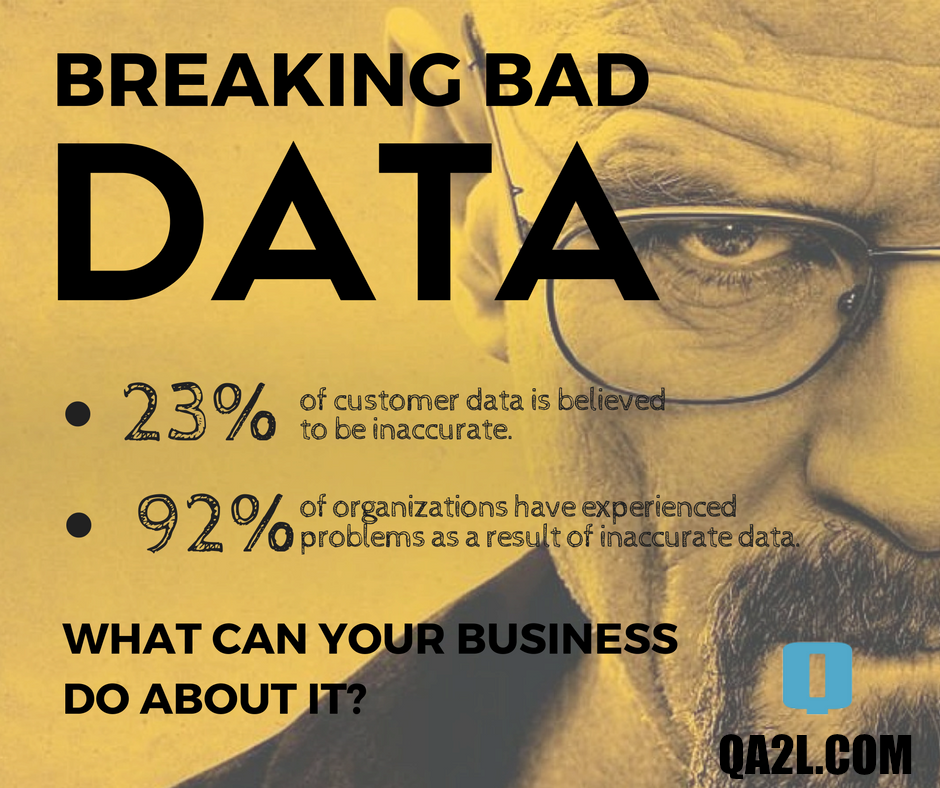
Breaking Bad Data
The list of catch phrases along with the money spent on activities related to Data Analytics has exploded over the last several years. The IDC Semiannual Big Data and Analytics Spending Guide predicts that the size of the big data market will reach $189 billion, a more than 50% increase over the $122 billion spent in 2015. The Harvard Business Review dubbed the data scientist job as the "Sexiest Job of the 21st Century".
But what is the true state of this industry, what’s behind all the spin and shine?
The goal and promise of Analytics has always been one and the same - affecting change through informed decisions. The better the quality of the information/analytics, the better the decisions.
Much too often the methods used to obtain or present the data take the spotlight. Asynchronous tags, controlled experiments, infographics, and cross-channel attribution - these are some of the terms used to describe the tools of our craft. However, the truth is that the only meaningful measure for assessing the state of analytics is the quality/accuracy of data. The other part is just data gymnastics.
So what do we know about data accuracy?
The 2016 Global Data Management Benchmark Report published by Experian shows that almost a quarter (23%) of customer data is believed to be inaccurate. The previous year's survey had another interesting tidbit - "92 percent [of organizations] have experienced problems as a result of inaccurate data in the last 12 months”. Some of the consequences listed as a result of inaccurate data include: lost revenue opportunities, regulatory risk, and difficulty to drive decision making.

Data inaccuracies in effect jeopardize the very purpose of analytics. Instead of enabling decision making, inaccurate data hinders organizations by adding time and effort for the requisite data error sorting. A practice all too common: 65% of organizations reportedly wait for the occurrence of data issues before fixing inaccuracies.
The underlying data inaccuracies are exacerbated by another trend. The constant data growth (both volume and variety), coupled with the increasing appetite for data, has lead to the deployment of easy to access self-service business intelligence (BI) systems. Usually such systems are implemented by business units with limited IT support and are accessed by users with little to no data understanding. Gartner predicts that in 2016 "less than 10 percent of self-service BI initiatives will be governed sufficiently to prevent inconsistencies that adversely affect the business.” To put it differently, nine out of every 10 decisions a business makes based on such data is likely to be disadvantageous.
In a Forbes interview Jennifer Zeszut (CEO of Beckon) summarizes: "If the data is bad—disorganized, incomplete, inconsistent, out of date—then the resulting decisions will be bad, too. If the data is a mess, if it isn’t trustworthy, our resulting decisions can’t be trusted, either. It doesn’t matter how pretty the pictures are, or how slick the dashboards. If the underlying data isn’t complete, organized, consistent and up to date, the story it’s telling is wrong."
So, what can organizations do to counteract these developments, to stem the tide of what Gartner describes as an "analytics sprawl"?
First and foremost - set the right expectations. Doing analytics is neither easy, fast, nor cheap. An unstoppable flood of always changing data points are being collected, processed, reported on 24/7. Regardless of what checks and balances are in place, something is bound to break. It is a matter of odds and time.
That does not mean, however, that we should raise the white flag. Here are four steps to not only minimize the impact of data inaccuracies, but to also put you on the path of developing your own data management process:
Step 1 - Start a data governance policy. A team or a person needs to be in charge of KPI/metrics development, tagging libraries, marketing campaign codes documentation, etc.
Step 2 - Invest in tools automating quality assurance checks, stepping through your key flows and identifying the thousands of data points that are being captured.
Step 3 - Implement automated real-time alerts across key metrics.
Step 4 - Discuss data management issues within the organization openly, improving overall awareness.