Debugging Alloy.js Tagging Implementations
What is Alloy.js?
Adobe's 2020 Virtual Summit revealed the first prototypes for a brand new data collection platform named Alloy.js. The development marks a departure from the legacy standards of client-side data collection where different MarTech vendors/solutions would each enable capabilities through the deployment of individual JavaScript libraries. The legacy of this practice is that is not uncommon for a website to call dozens of different JavaScript libraries.
The Alloy.js framework changes this approach by swapping the different libraries with a single JavaScript that sends data to an Edge destination in a first party context. The Edge instances can in turn be configured to distribute requests to different solutions enabling analytics, personalization, audience measurement, A/B testing or other services. This approach promises many benefits -- improved page performance, standardized data collection, more reliable visitor identification, to name a few.

Server-Side Tracking is Changing The Landscape of Automated Data Validation
All basic methods of data validation adopted by mainstream data governance solutions today revolve around listening to the HTTP requests issued by the browser. This method (sometimes taking the shape of bulk spidering of pages by automated browsers) allows the identification of different tag vendors (Adobe Analytics, Google Analytics, Facebook, etc) across a given site and creates various inventory-like reports that list types and counts of tags, values of tag parameters, cookie sizes and properties.
We have previously discussed the deficiencies of this data validation approach, but with Alloy.js this type of inventory of tags becomes even more irrelevant than it is today. The Alloy.js library sends a single HTTP request that then gets redistributed server-side to different vendors. Since the actual tracking requests to Adobe Analytics, Target, or any other vendor, get sent from the Adobe Edge back-end server to the corresponding vendor endpoint, none of the data transmission leaves a trace in the browser. Any methods of data validation that stop at the page load will therefore miss out on most of the tracking activity that takes place.
At the same time, the HTTP requests generated by Alloy contain the full data payload that enables a variety of solutions downstream to do their best at painting a picture of the users. It becomes critical to make sure that the correct name-value pairs fire at the exact user interaction that is expected to trigger them. Even before the onset of server-side tracking solutions like Alloy.js, this high note has been the trickiest part of data validation. It is easy to scan pages en masse. Navigating the conversion journeys that bring revenue or brand exposure and making sure the tracking correctly captures the user experience—that's hard, and important. With Alloy and the dawn of server-side tracking, being able to validate each and every tag that fires from the browser to the back-end server becomes more of a necessity than a luxury.
There are no re-takes. When you have a "single source of truth" delivered to all your solution vendors, it better be right!
Manual Validation Options
The manual validation of Alloy.js requests can be accomplished in a number of different ways.
- Adobe's latest version of the Experience Cloud Debugger Chrome plugin allows you automatically see the tracking requests going to the Edge destination.
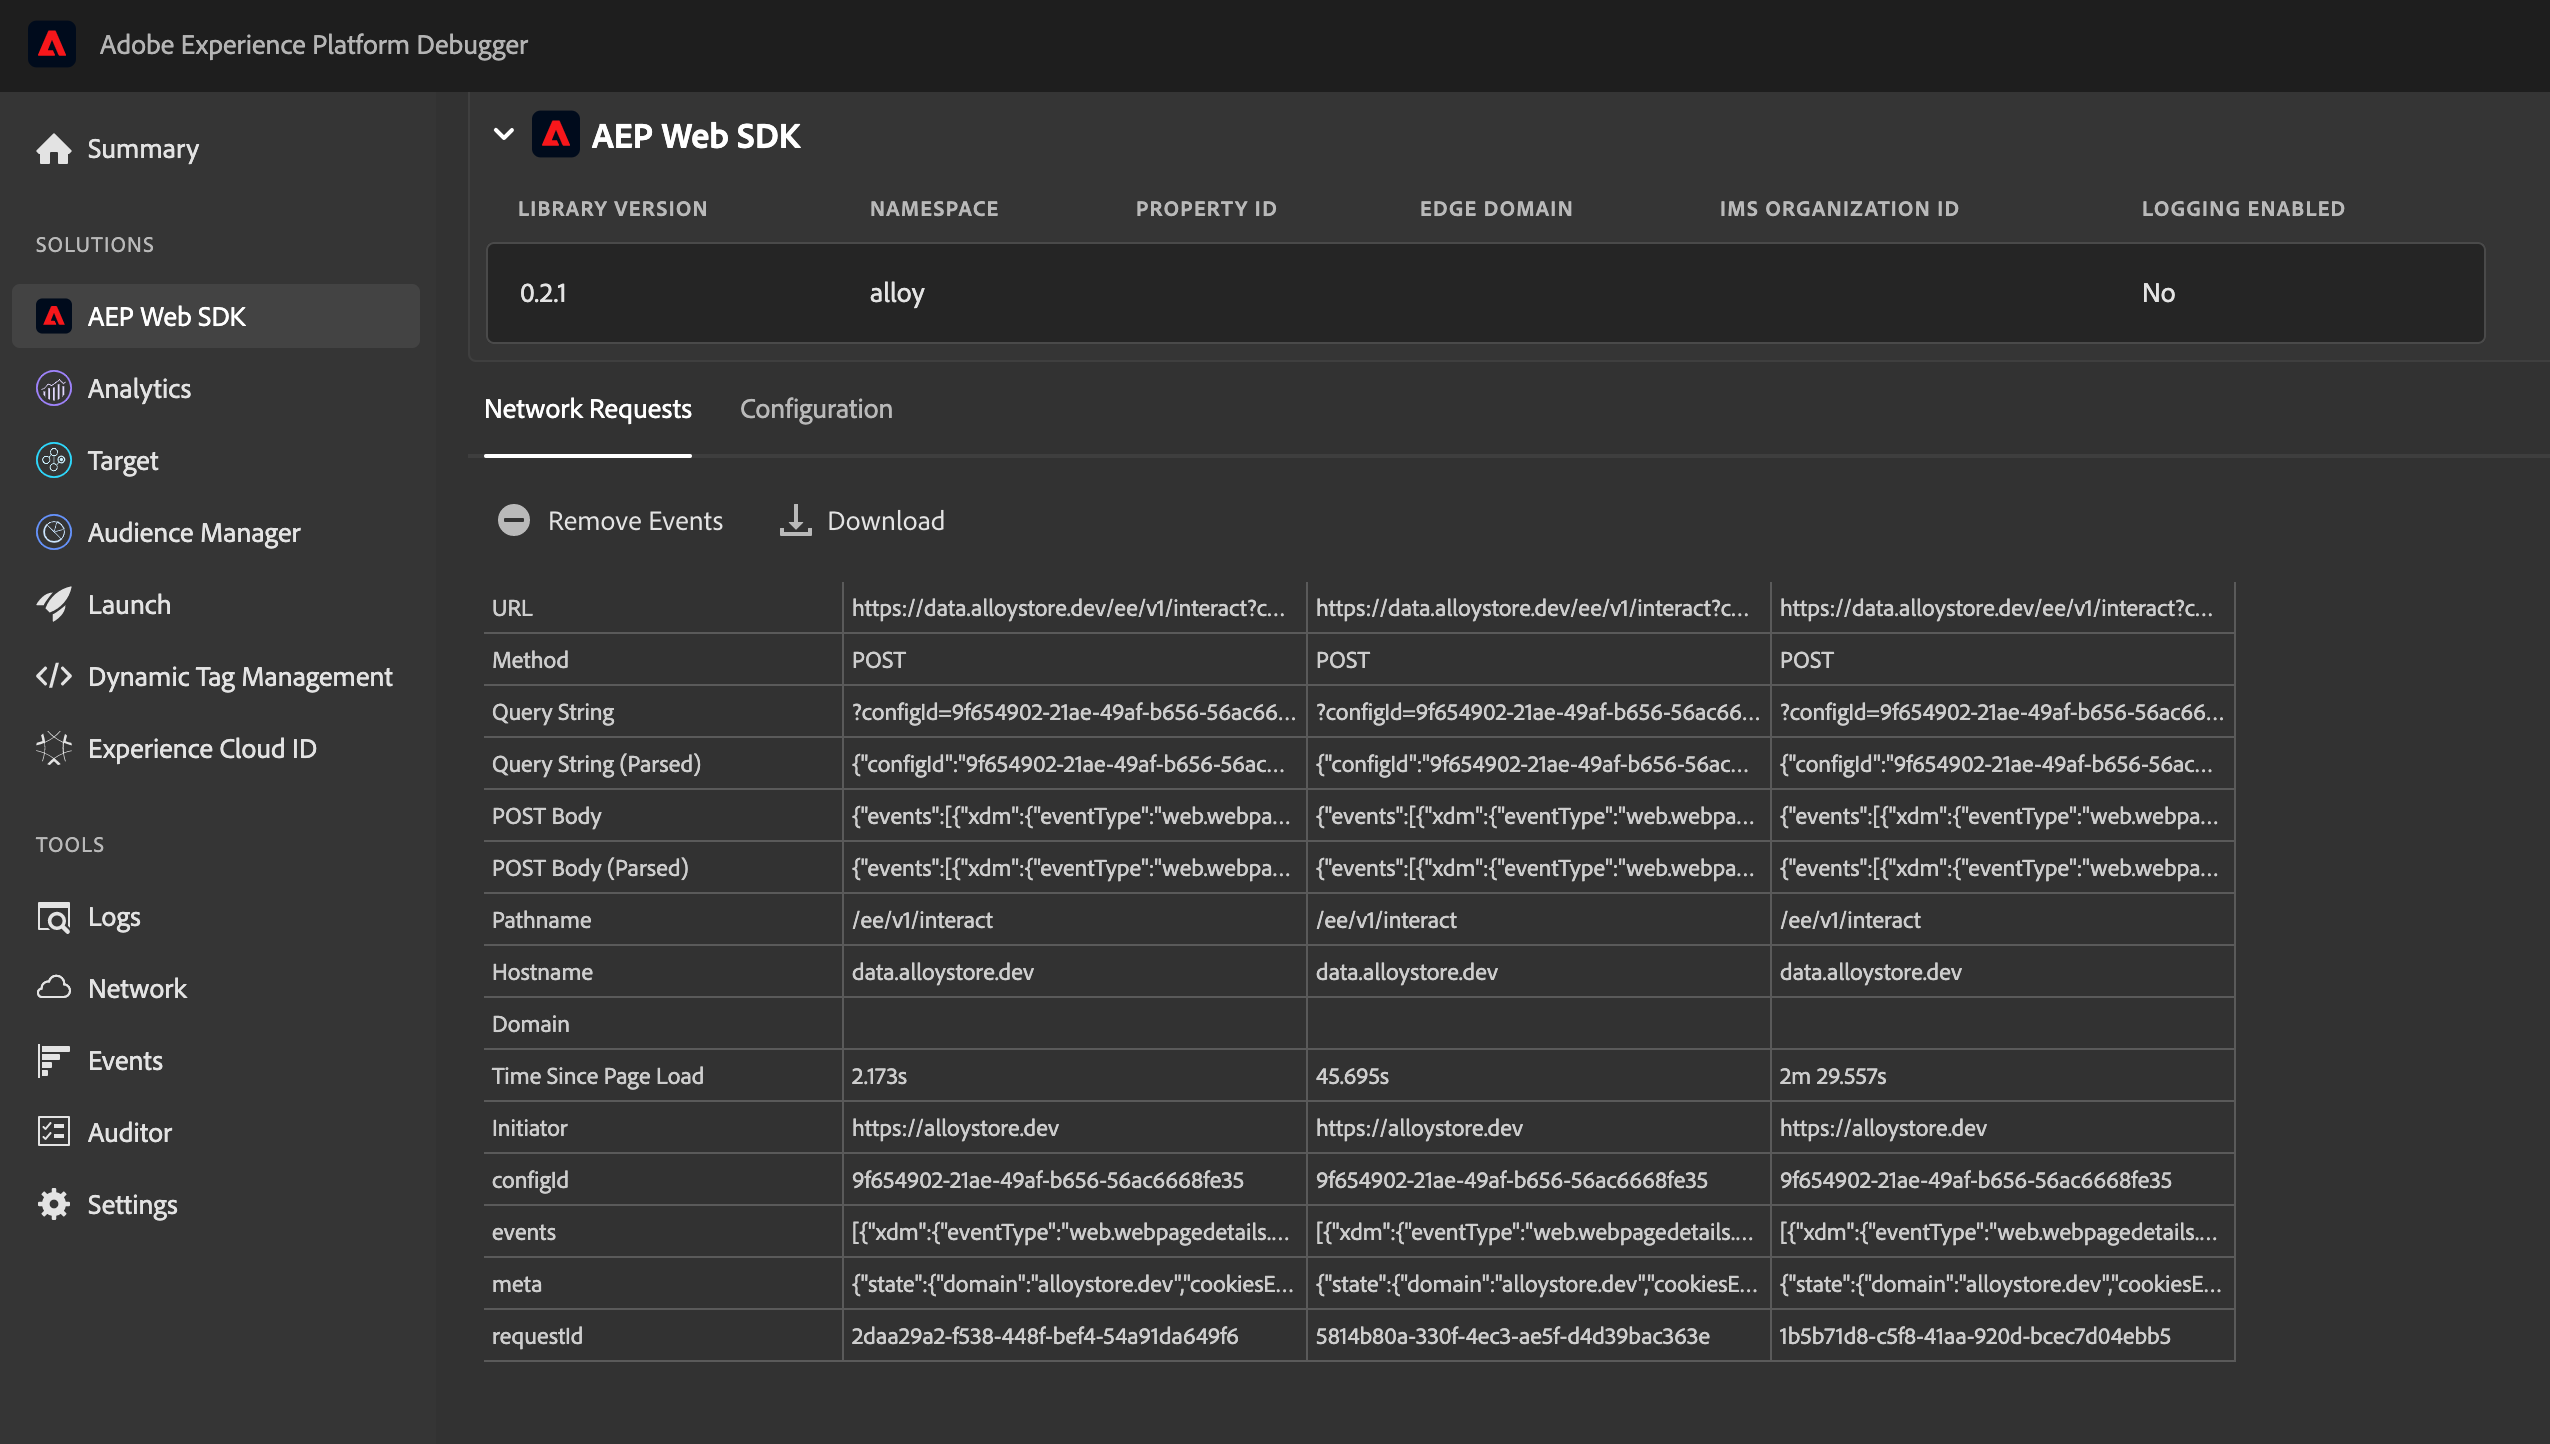
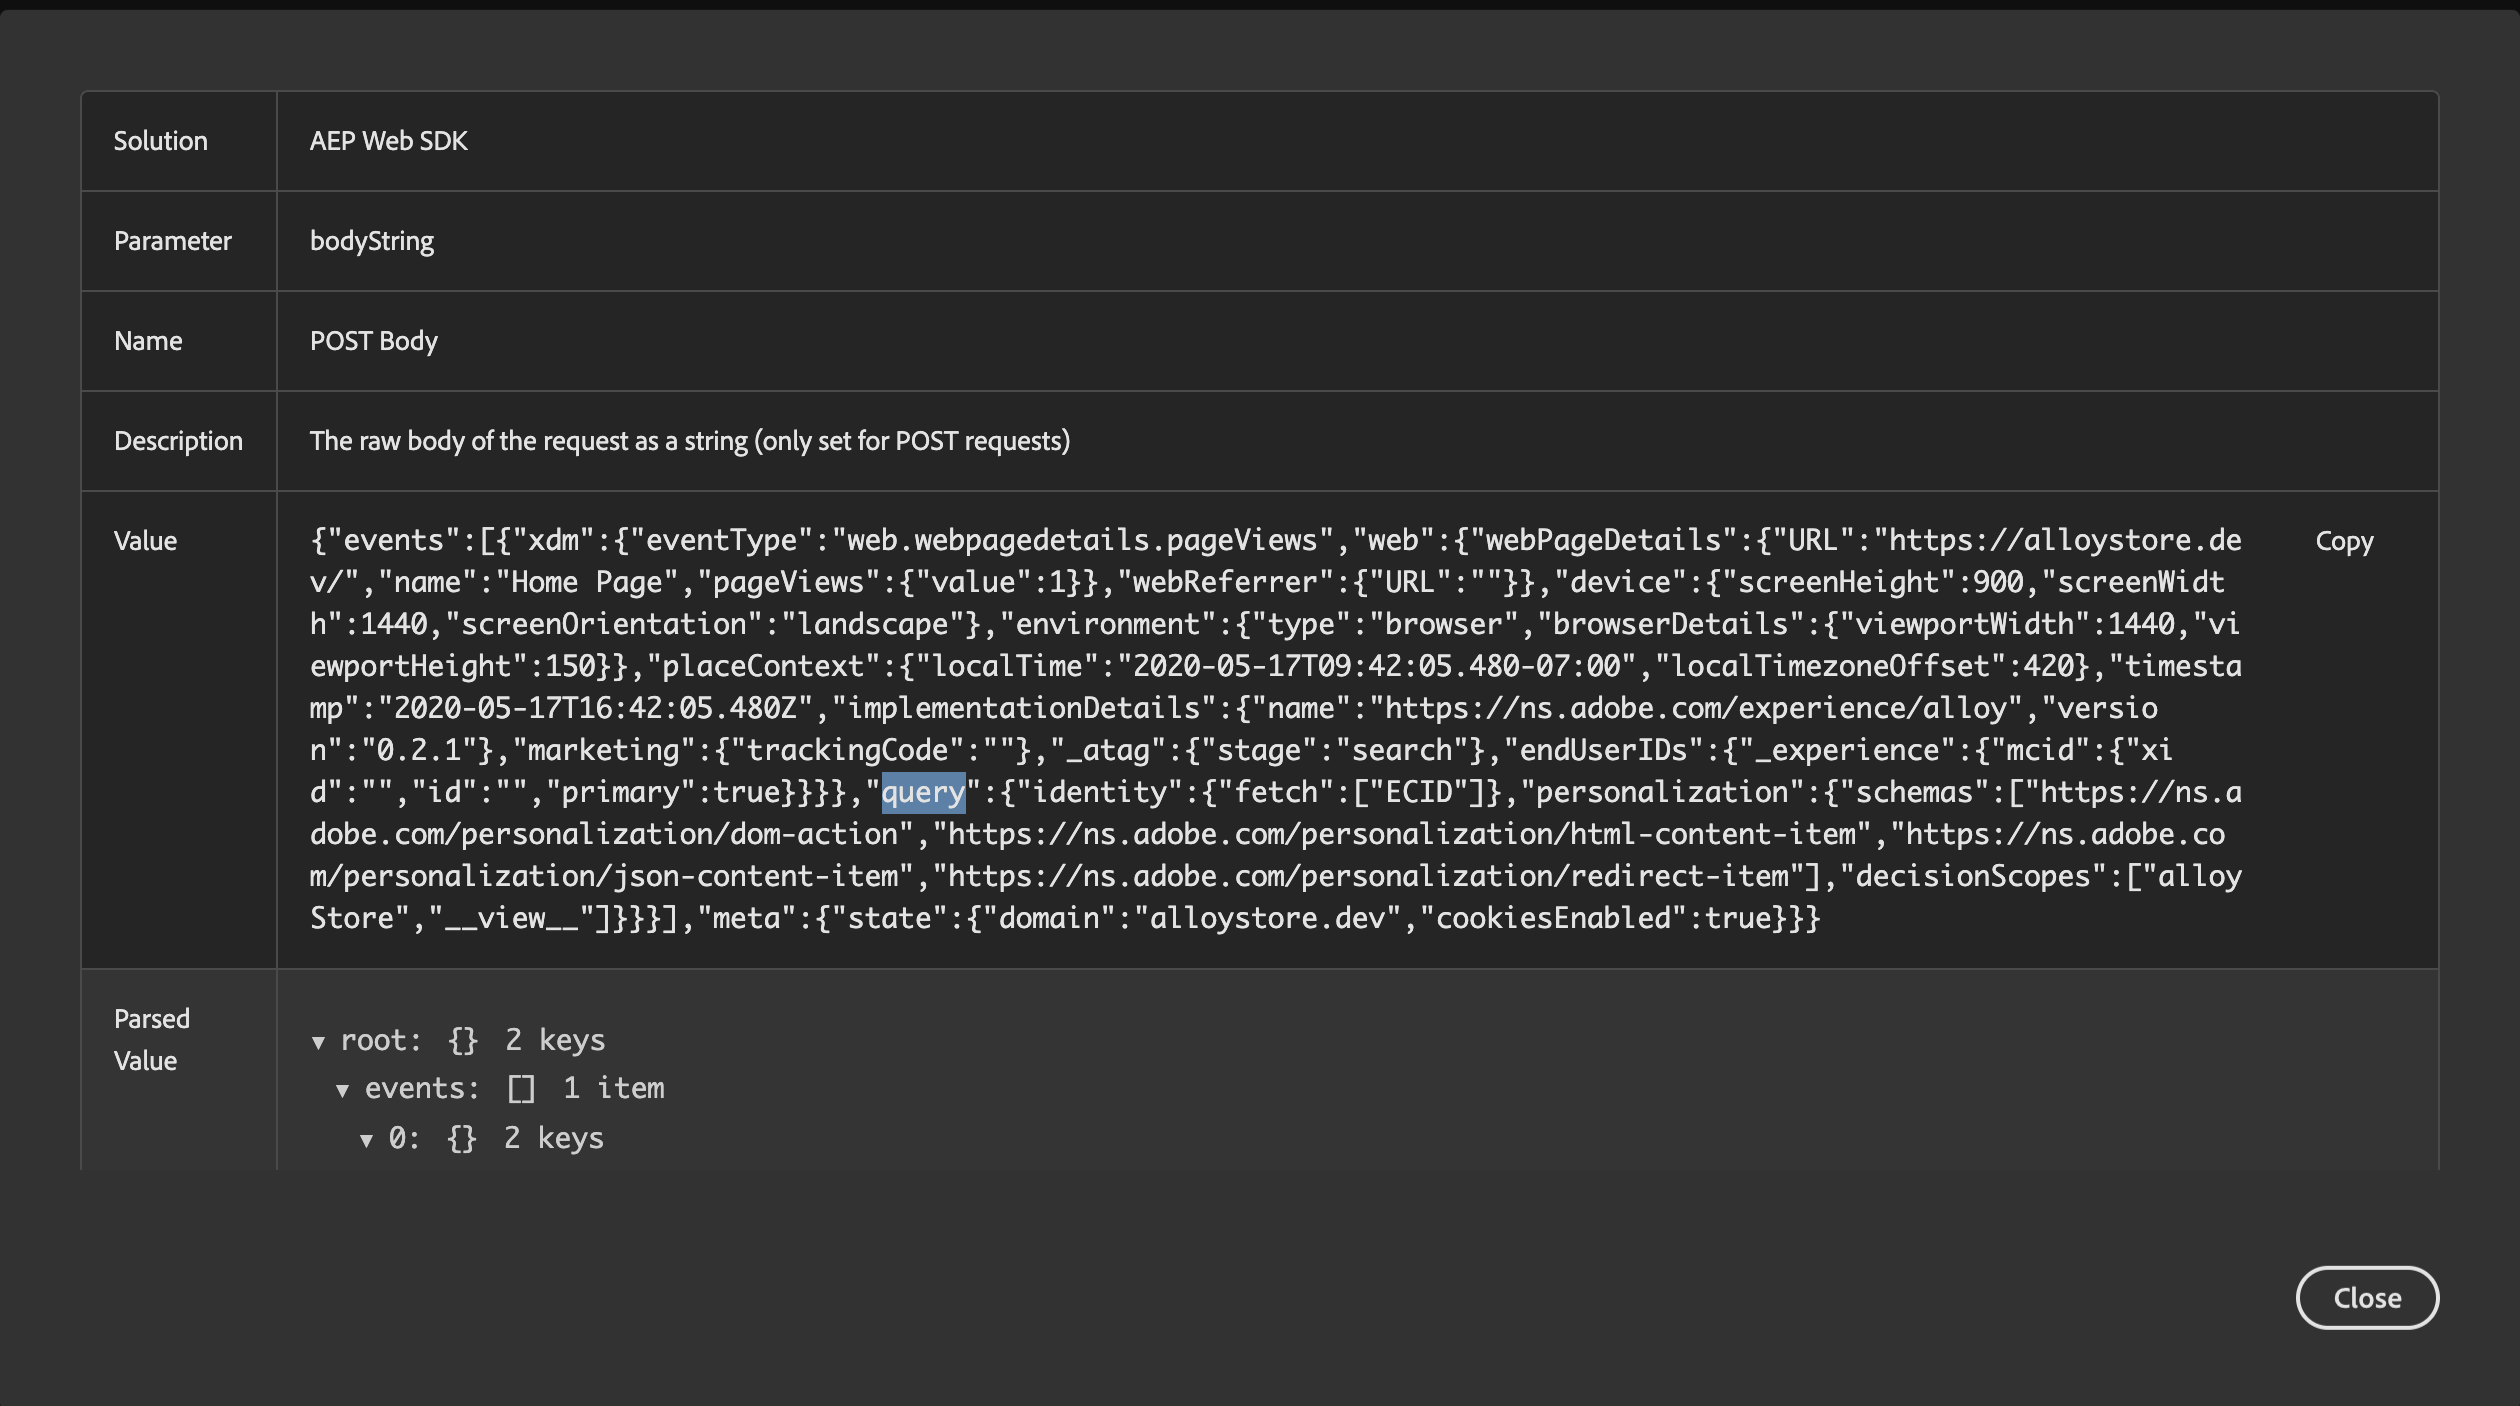
Double-clicking on the individual fields allows users to inspect the details of each value/name pair:
- Another great option for manual inspection of requests is using the network tab directly in the browser's dev tools. To filter only the network requests generated by the Alloy library, one can search for the following string "/interact?":
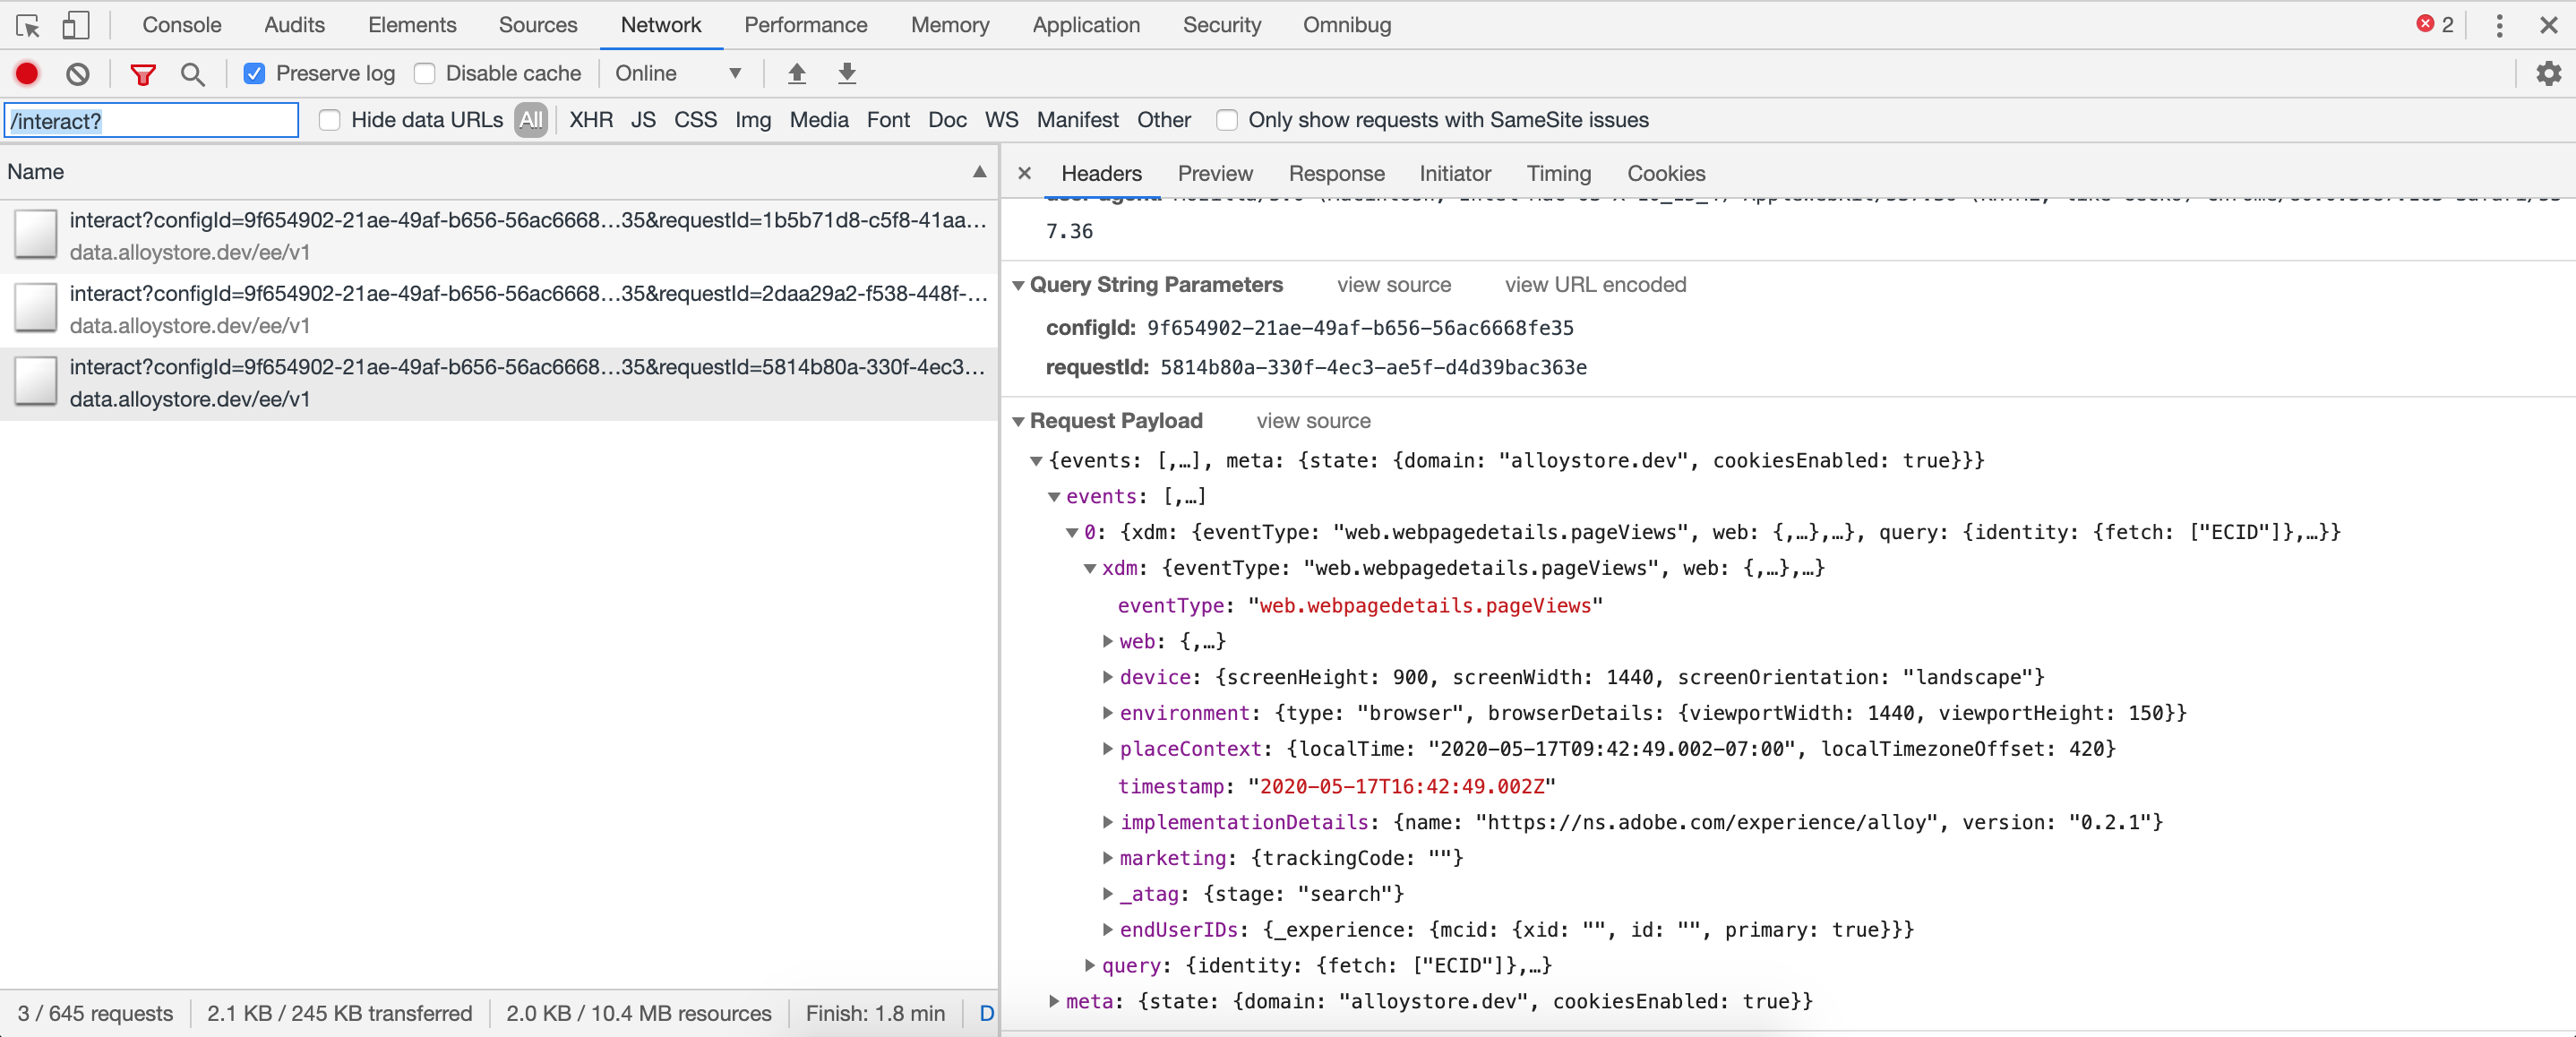
At the moment, individual parameters in the post body of the request can be more easily inspected through the Network tab in Google Chrome Dev Tools where each parameter/value element in broken out in its own row. But it's pretty much inevitable that the Experience Cloud Debugger will catch up in this respect. Adobe's documentation provides additional instructions on advanced debugging techniques, including setting a specialized debug parameter.
Automated Validation with QA2L
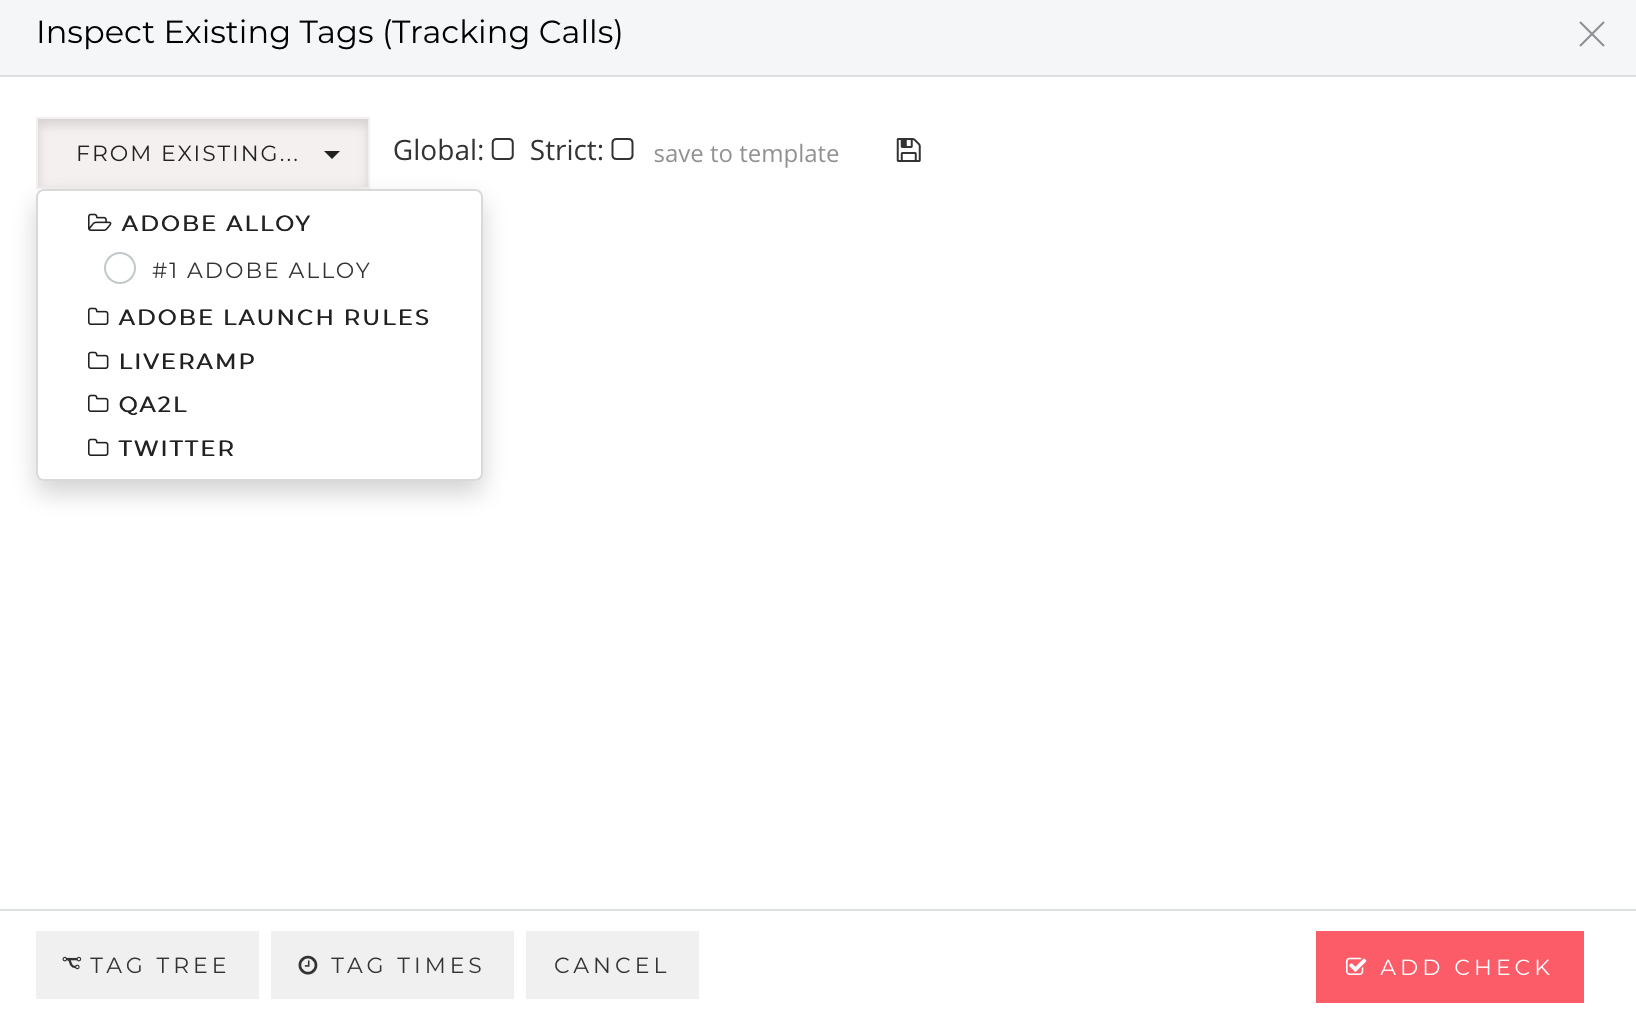
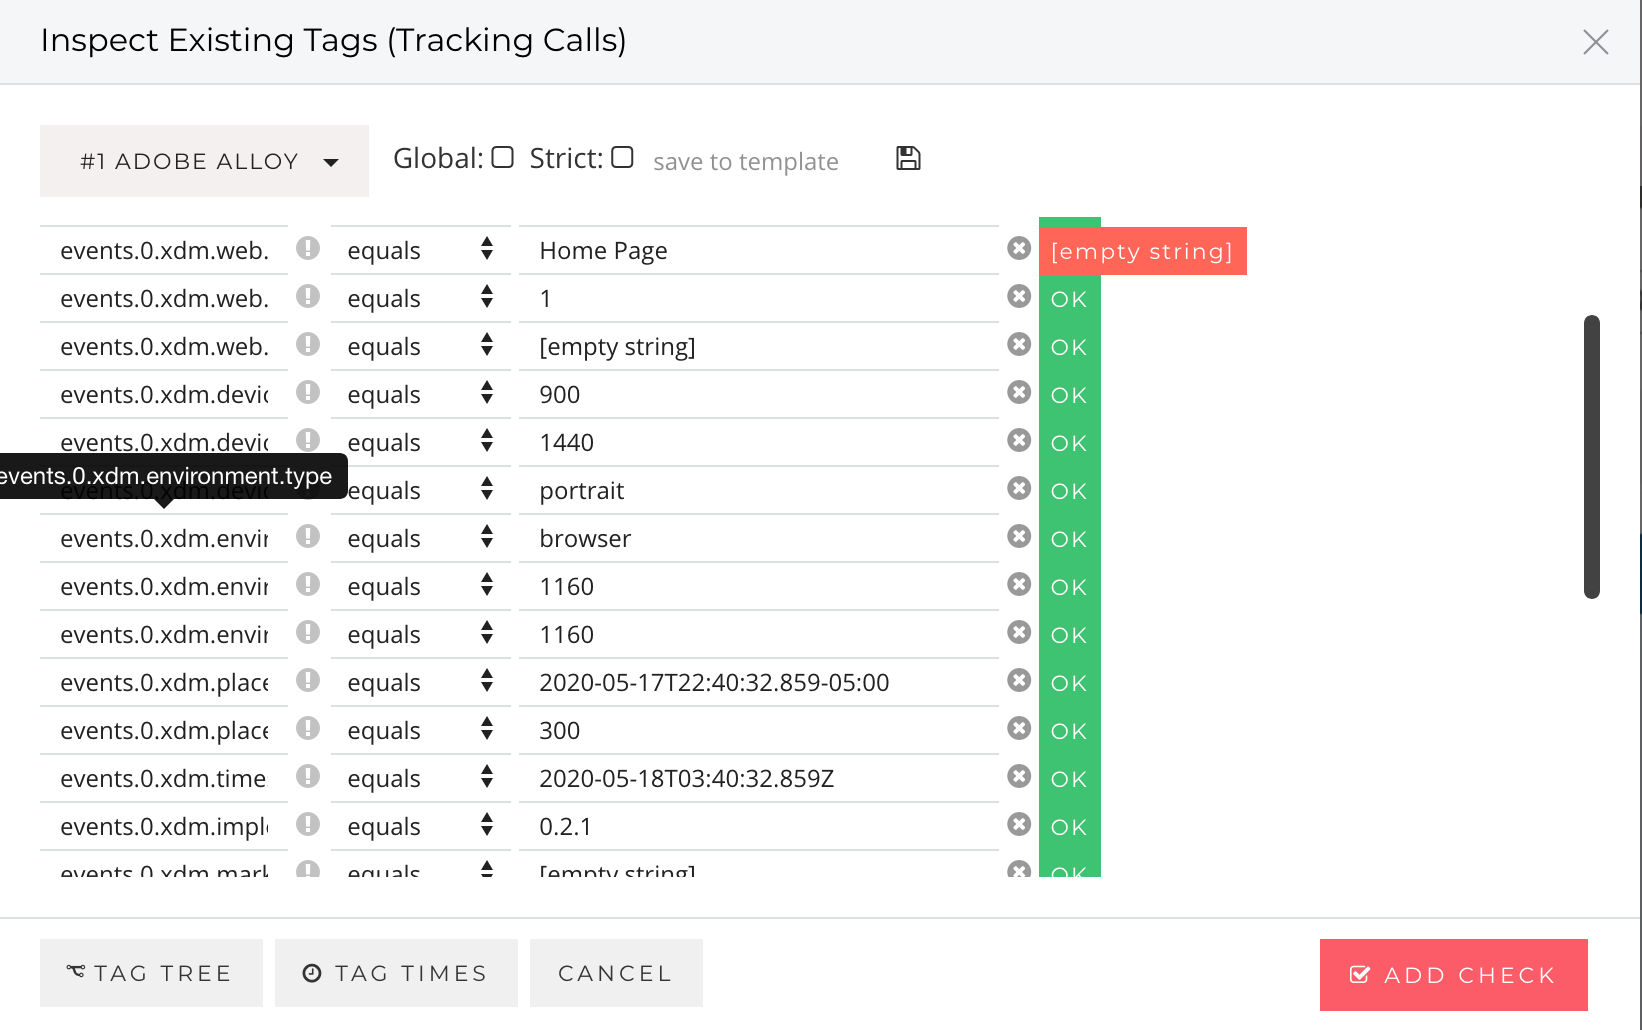
As you design journey validation tasks (what we call "flows") involving a series of user interactions, our platform automatically detects any requests to the Edge endpoint. The requests are available for inspection under the "Adobe Alloy" folder in the list of detected tags:
Selecting the Adobe Alloy tag not only breaks down the request payload, but also allows you to build advanced validation rules for each of the properties in the POST body:
Using the QA2L Design interface, you can quickly build validation logic and automate continuous tag validation for even the most complex user journeys, those that fire KPI metrics, either via Alloy.js or using more conventional means.
Advanced tag validation can be performed by injecting custom JavaScript to set Alloy's debug mode to true and inspecting the console.log messages that get returned:

If any of this sounds interesting, be sure to contact us and give it a try!
Tags: Data Quality Adobe