Adobe Customer Journey Analytics Clears a Path to Improved Data Quality
by Nikolay Gradinarov
Exciting new capabilities are in store for Adobe Analytics. Hot on the heels of announcing Alloy.js, Adobe is also unveiling big plans for the maturation of its analytics platform.
In a session titled “Customer Journey Analytics: The Omnichannel Future of Adobe Analytics” (part of Adobe’s 2020 Virtual Summit) Trevor Paulsen and Jen Lasser lift the curtain on a set of new Adobe Analytics features that add up to a major step in the evolution of the product. Without any hyperbole, they transform it from a tool specializing in web analytics to an open-schema, fully-customizable data analytics platform.
Historically Adobe Analytics’ primary focus has been on clickstream data collected through standardized javascript libraries, Native App SDKs, or insertion APIs for server logs and IoT-generated data. This data has been organized in a standardized schema following the ubiquitous web analytics hierarchy of Visitor > Session > Hit. Addition of custom (first or third-party) data has been generally possible through capabilities that enrich Adobe’s existing dimensions/metrics through various forms of lookups/classifications, DB Vista rules, data sources, customer attributes, built-in integrations with other Adobe offerings or vendors, etc.
Customer Journey Analytics (CJA) represents an upward paradigm shift. Clickstream data is no longer THE data source, it's ONE OF MANY data sources. CJA makes it possible to link, define, process, join, visualize, and analyze any type of standardized data.
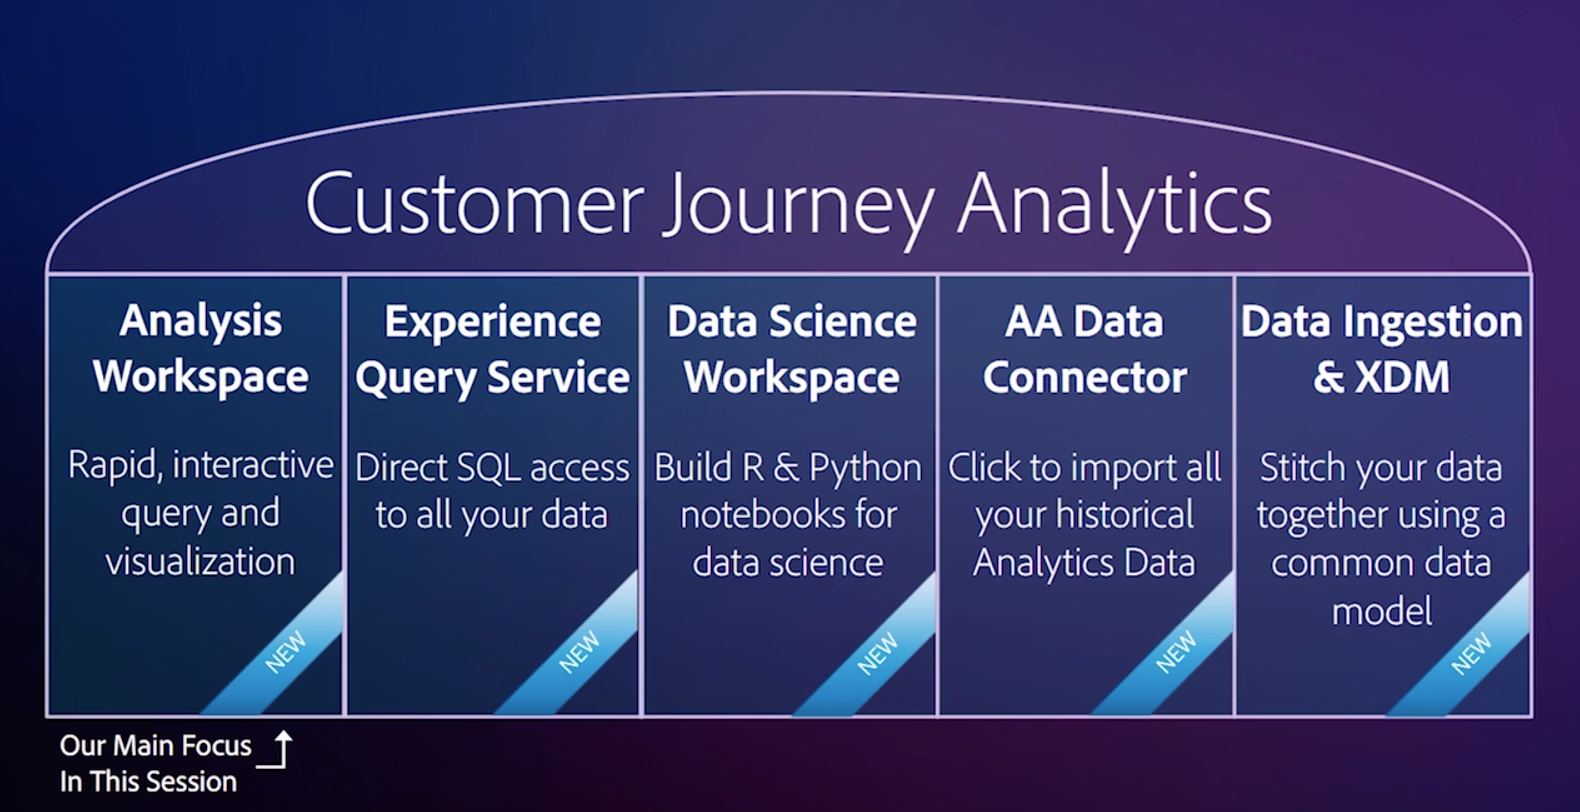
Key Aspects of Customer Journey Analytics
- Clickstream data is now just one of many possible data sources. Adobe is opening the door for other data standards (CSV, JSON, etc) to be ingested through a variety of methods (S3, Azure, FTP, etc..) in addition to data natively available on the Adobe Experience Cloud (Analytics, Target, Audience Manager).
- Once in the system, the data can be organized in a customizable schema termed the Experience Data Model (XDM) with the ability to specify common keys, data fields, and privacy controls.
- Connections can be created to combine data from multiple datasets (and dataset types). These may include event, profile, and lookup data which together constitute the grand total of all activity generated by a customer both online and offline.
- Data Views take the concept of Virtual Report Suites as they exist today in Analysis Workspace and expand it to enable additional controls on the data made available by connections. This makes timezone and session time-out intervals configurable, and also drive on-the-fly attribution and expiration properties for individual dimensions (applied retroactively on all data!).
- With Query Service the available reports are no longer limited by data cardinality, making it possible to write SQL and retrieve data down to the most granular level.
The combination of different data sources is key to better understand the customer journey and that is the primary use case Adobe promotes, but in reality these new capabilities open up exciting possibilities for a host of other applications as well.
 |
||
| In The Orville (S1E11), the ship makes a narrow escape by soaring above a 2D universe. This is what the old Adobe Analytics may look like from the deck of the new Customer Journey Analytics platform. | ||
Customer Journey Analytics with Respect to Data Quality
Several tag auditing platforms can help organizations automate the validation of tags across key user journeys. In the process, they generate a variety of meta data about the quality of the tagging implementations. With Customer Journey Analytics, this kind of data can now naturally co-exist with your standard Adobe Analytics data.
What are the benefits of making audit scores available directly in your reports?
- Your analysts will have a direct gauge for the quality of the data they work with. The audit results will be right in front of them, telling them that a metric passed 7 of the 7 audits for in the past week, or that a dimension started failing its audits after the 29th of this month, and is therefore to be avoided.
- The audit score would get updated dynamically as the audits take place, presenting the analysts with a living history of what the score was at different times for different reports. As a result, when dealing with historical data (assuming it was audited) analysts will know if there are any necessary adjustments to make because of known tagging defects impacting this particular part of the data without having to dig through email threads or JIRA tickets.
- The quality of data will be consistently and objectively communicated at a company level.
What are some of the options for presenting Audit Scores?
- Audit scores should be specific, indicating the report suites and variables that were audited (eVars, props, events) and flagging the data points that faulted.
- For an audit score to be meaningful, it should be based on checks against user-specified rules, not indiscriminate checks. In other words, it is not enough to simply capture that event1 was triggered. It is important to know that event1 was triggered in the correct flow, at the correct time/step/user interaction, and in the correct quantity. (While it is always tempting to think that new technology can solve our specific problems somewhat magically, this is yet another case in point that tools are as good as their wielder. Specifying the rules is a prerequisite to generating benchmarks that are relevant to what the organization is seeking to measure.)
- The audit score would ideally contain additional information allowing you to trace a potentially single source of multiple errors. In the context of a site journey, for instance, the stage at which a specific variable exposed a defect is important to capture. If eVar1 is set on the page where users provide the search term in an "Onsite Search" flow, the data point flagged as defective could look like this: "OnsiteSearch:SearchTermProvided:eVar1".
Here's a sneak peek at how QA2L's recommended Adobe Analytics Audit Scores integration may be organized under CJA:
1. A separate dataset serves as a data quality scorecard and gives you the audit score for each of your report suites at a glance: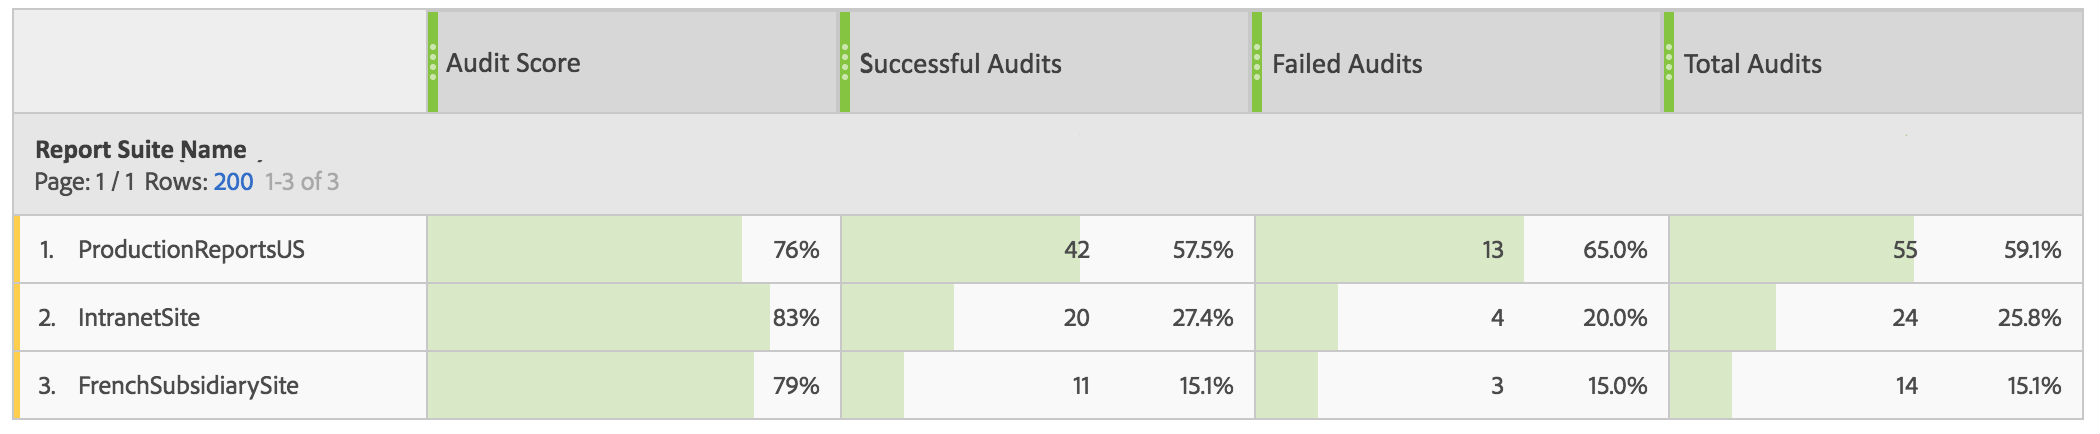
2. This comes with the ability to see audit results broken out by variable type...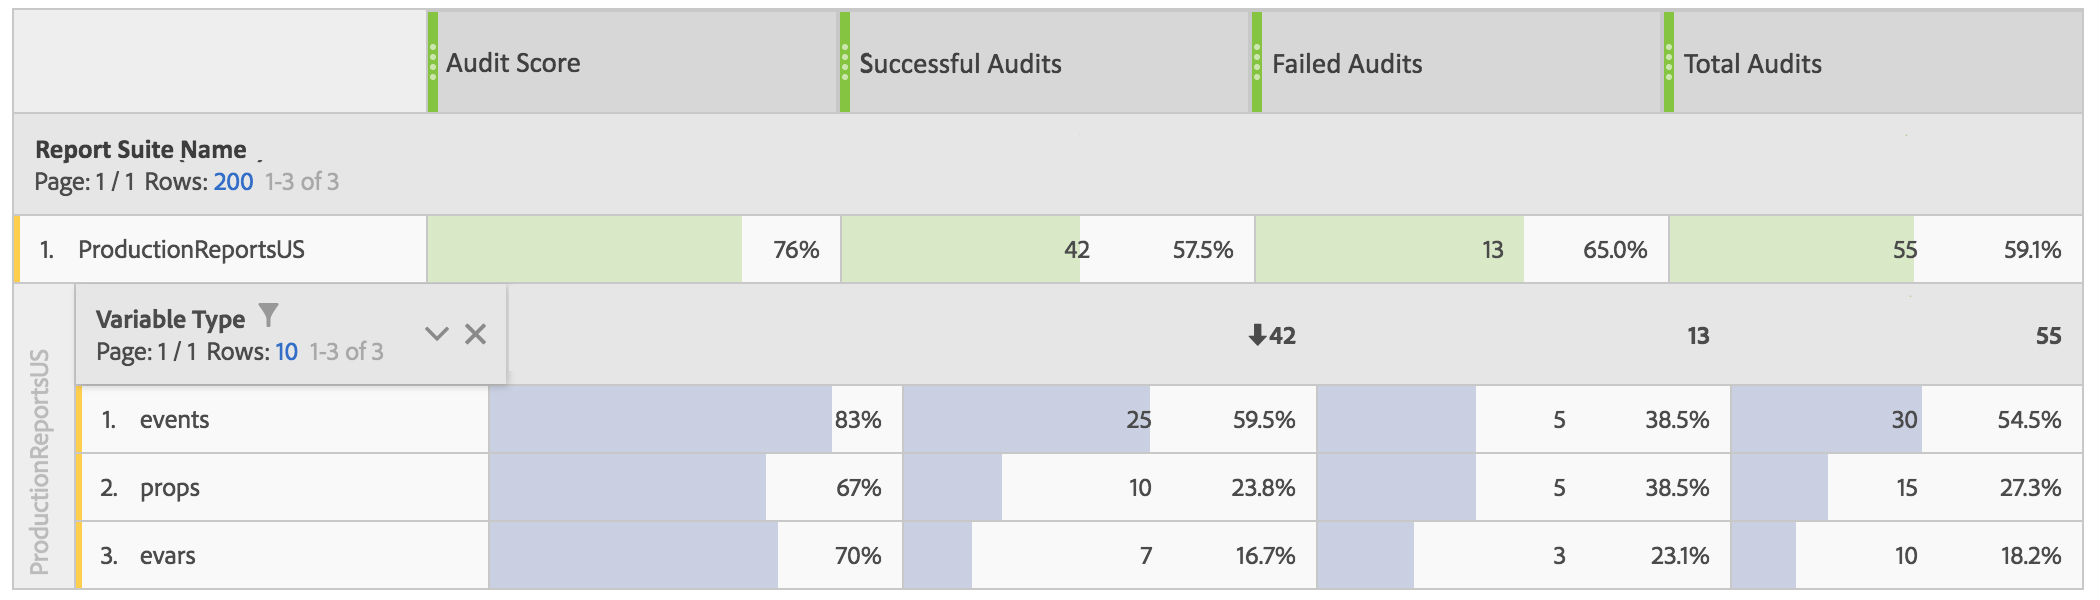
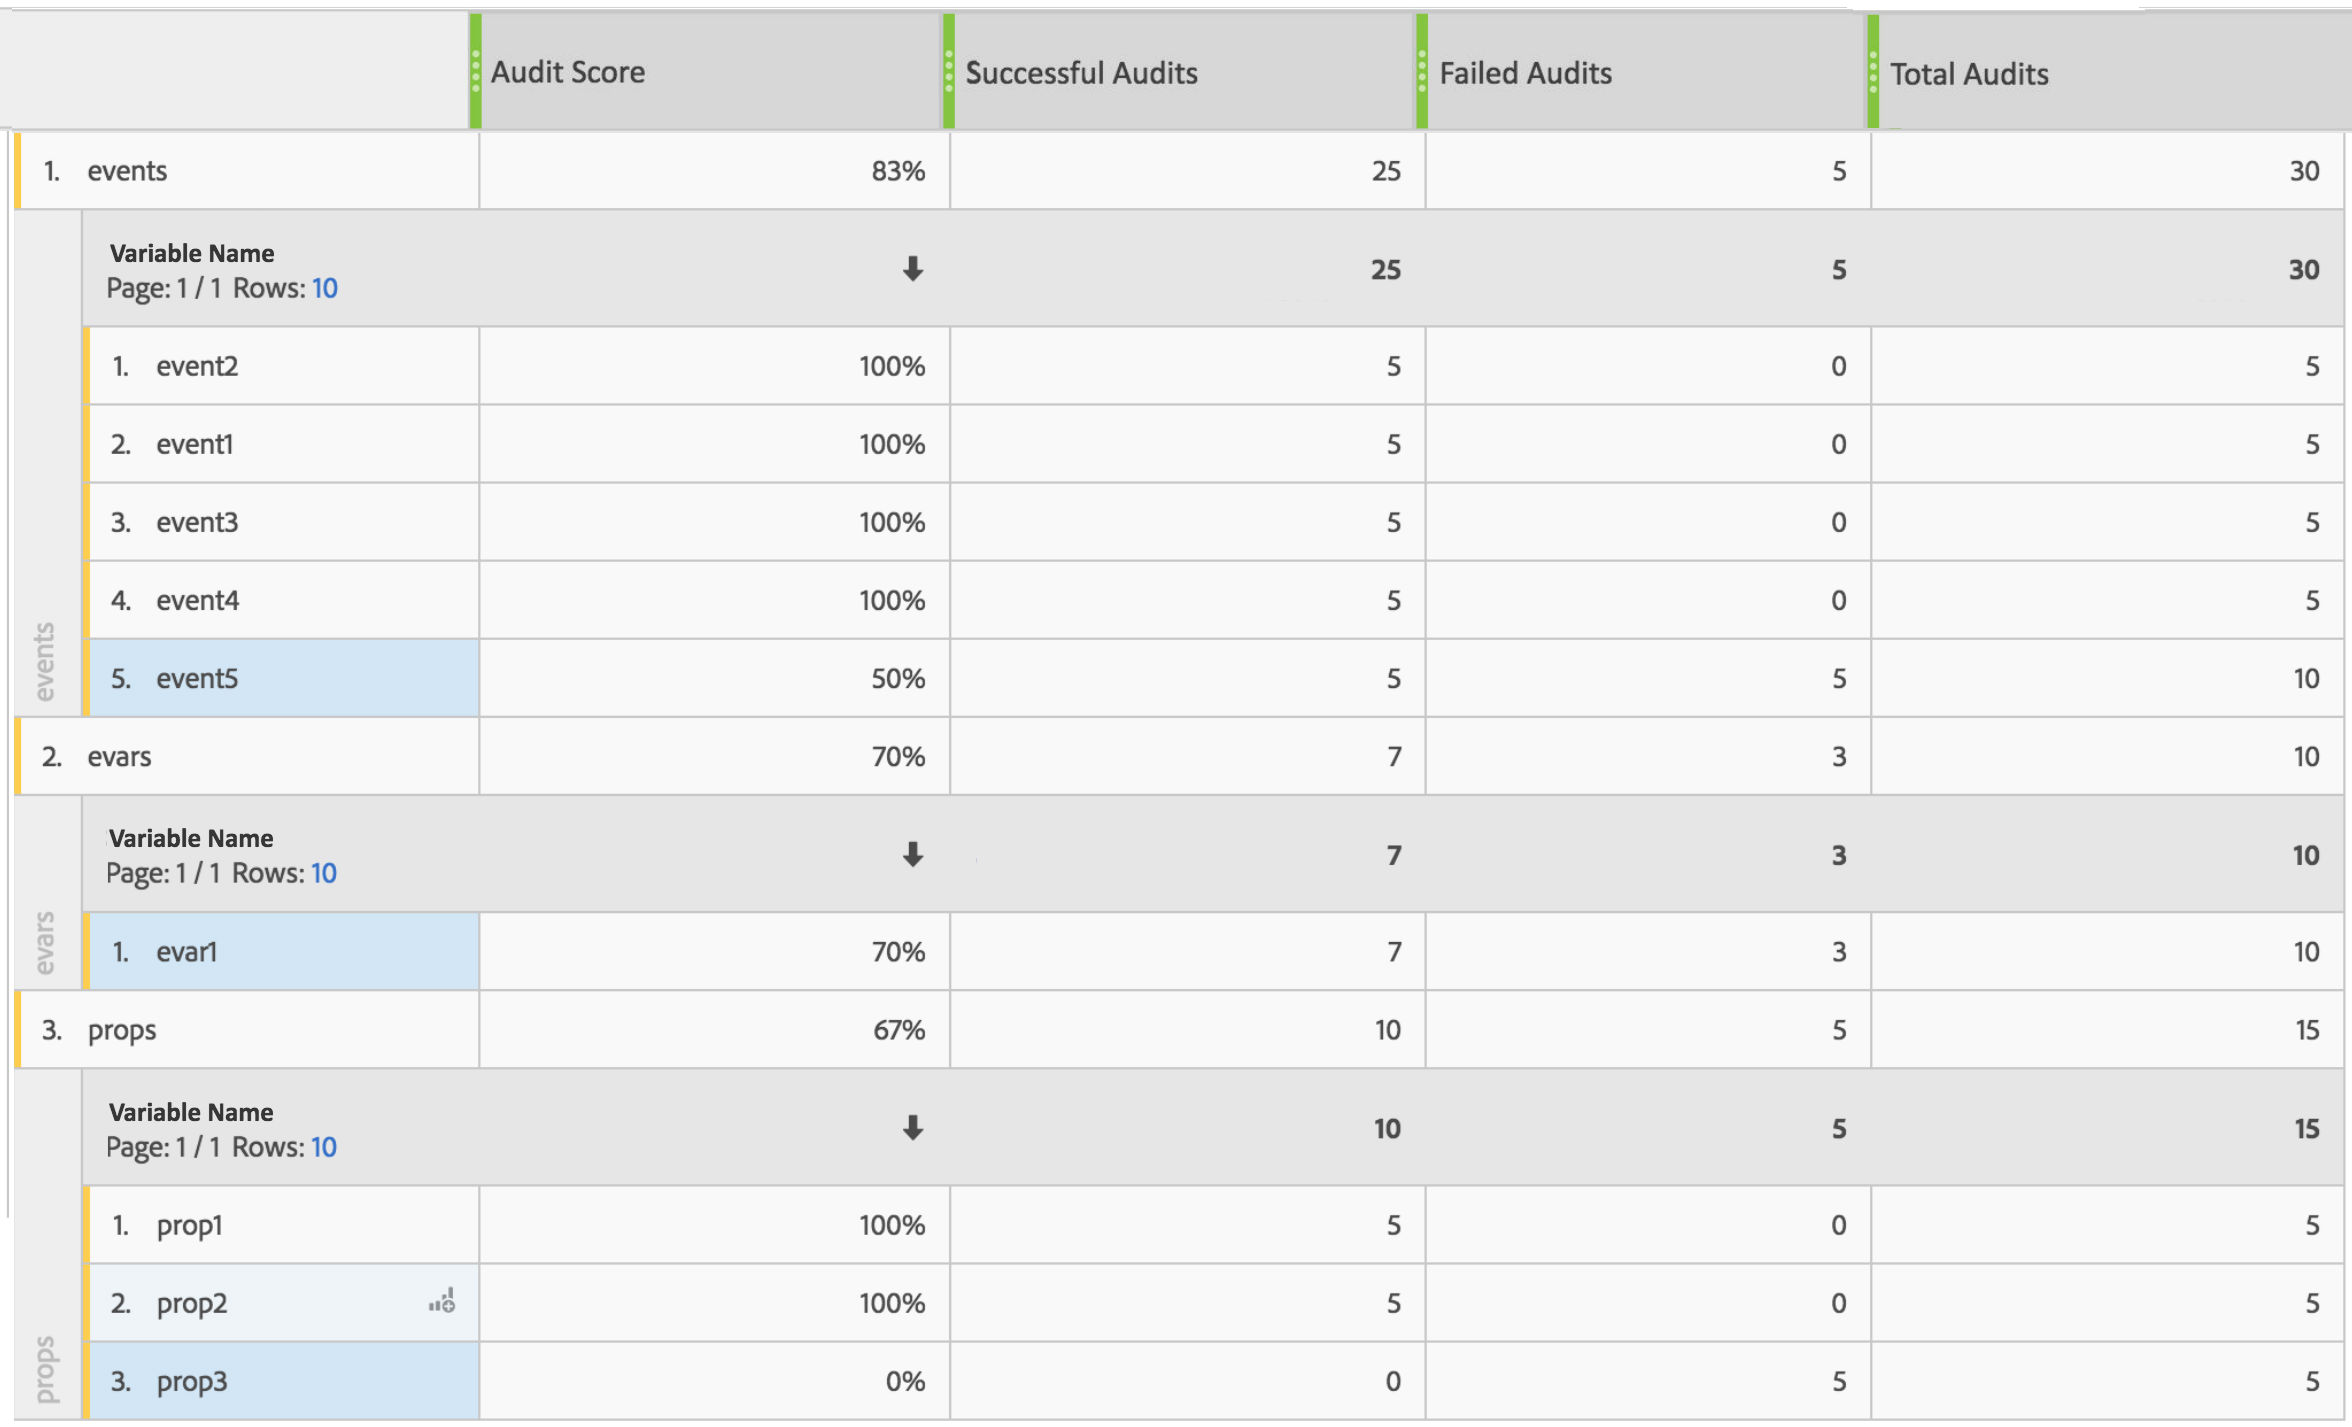
3. ...as well as to further examine each variable:
In the example below, one can easily see that the quality score is lowered by three individual variables:
- event5
- evar1
- prop3
4. Zooming in on eVar1, we see that the variable is correctly set on the desktop-facing website, but the mobile-optimized pages are causing the audit to fail. We can also tell that the failure is occurring on the step where the user has provided a keyword within the Onsite Search Mobile Flow.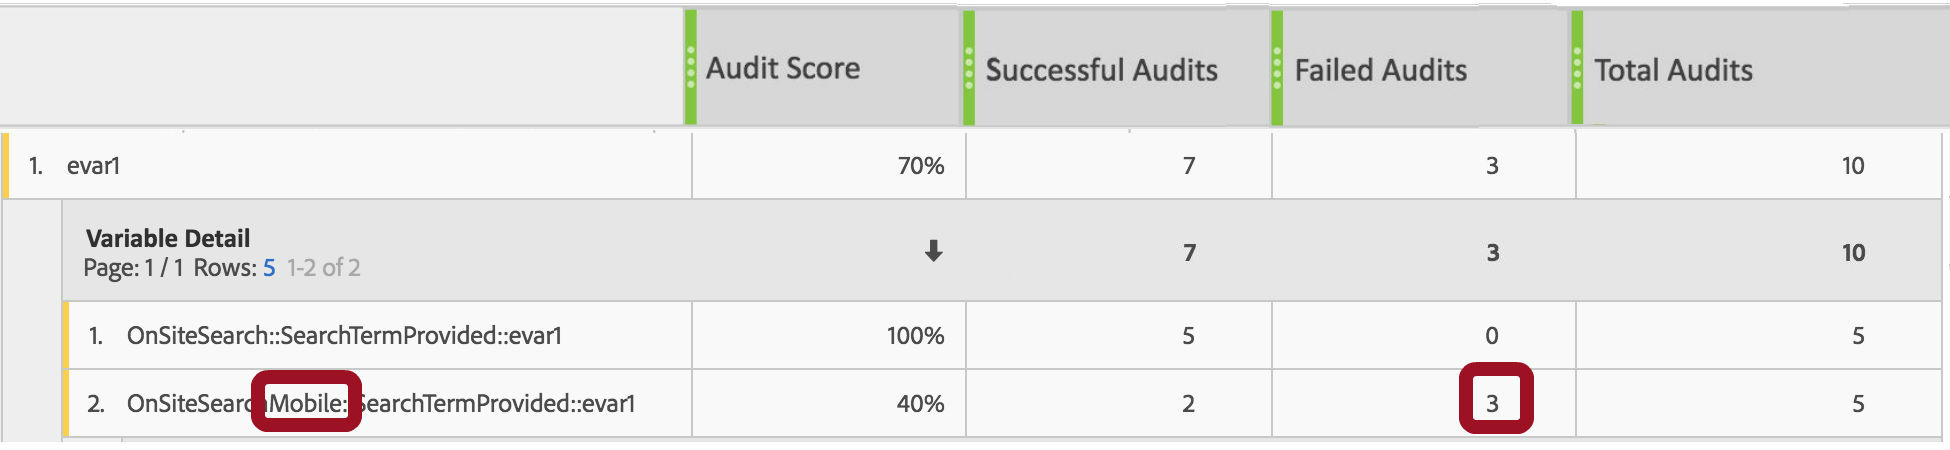
Just like Adobe Analytics is no longer landlocked to website clickstream data, the QA2L platform can provide Audit Scores of specific relevance to email marketers and native app experience managers. As the CJA platform aims to elevate AA into a single source of truth across a multitude of marketing channels, it becomes all the more important to ensure that data quality is part of that evolution.
And Beyond...
Enabling audit scores in Adobe Analytics is just one example of the types of meta data Customer Journey Analytics can make available inside Analysis Workspace. Another practically universal use case is documentation and annotation.
Adding documentation/definitions for individual data elements along with business questions/requirements and change/version control references can add up to a powerful data governance boost to any fast-paced, at-scale implementation.
The features unlocked by Customer Journey Analytics seem to provide a whole slew of exciting new opportunities in terms of data quality and governance that we will be sure to explore as we learn more particulars from Adobe, and then again when organizations begin to adopt the new paradigm in their own unique ways.
Tags: Data Governance Data Quality Adobe