Amplitude Event Tag Validation and Automation
In this blog post we go over options for manual and automated validation of the client-side tags used in Amplitude event tracking.
Manual Validation
There is a variety of methods for manually debugging and validating Amplitude events and their attributes:
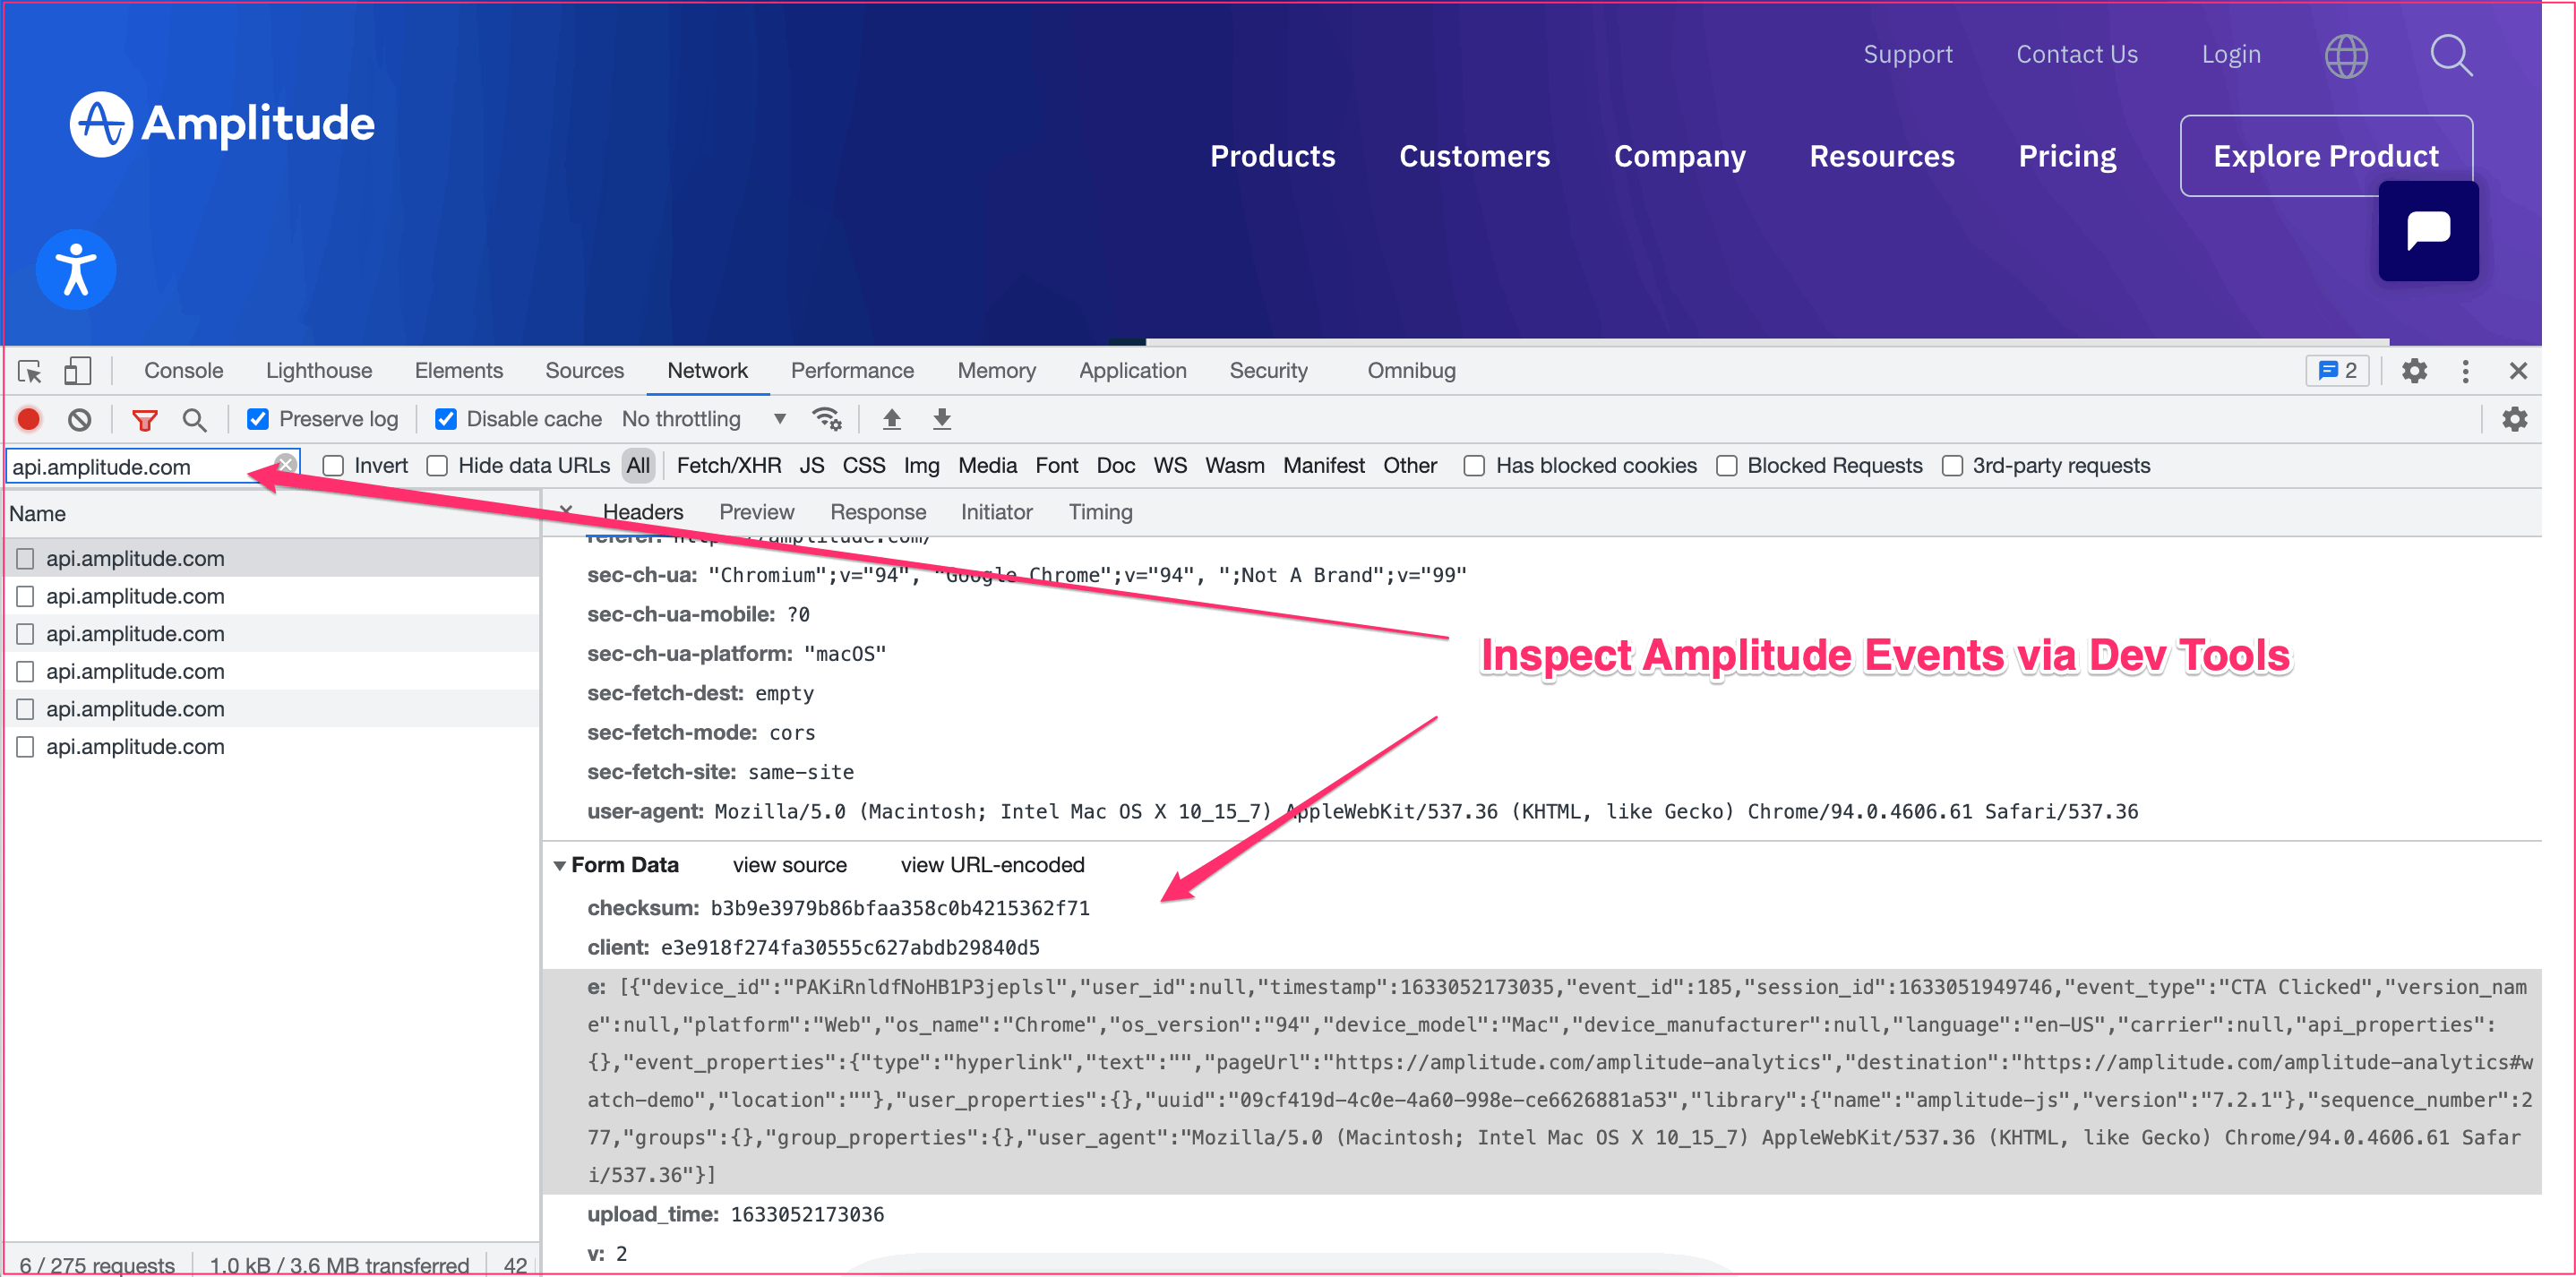
- Users can inspect Amplitude network requests in the browser Dev Tools or through proxies such as Fiddler or Charles. Finding the network calls is relatively easy—all you need to do is select the Network tab and apply a filter to only show requests to the "api.amplitude.com" domain. The requests use the POST method and most of the payloads are JSON objects.
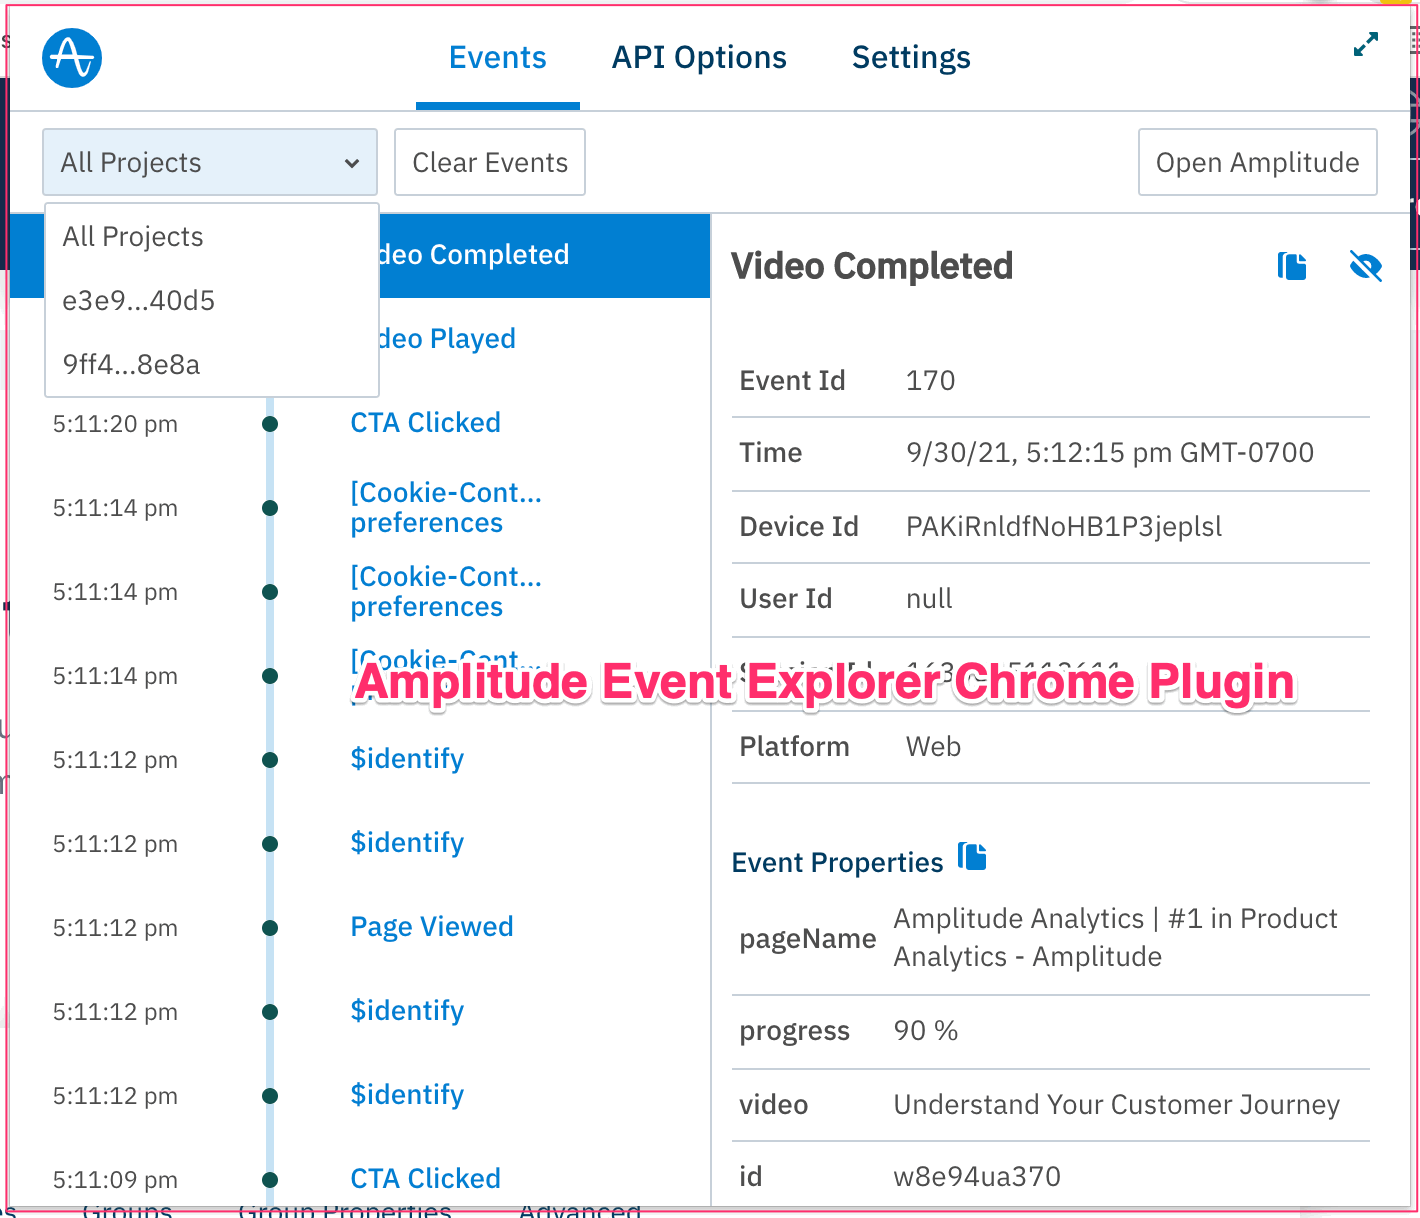
- Another good option is using the "Amplitude Event Explorer" Chrome plugin. Similarly to inspecting network requests in the Network tab, this browser extension allows reviewing events and their properties in real time, additionally organizing the event stream in a neatly ordered timeline. The plugin also automatically parses the JSON payload, making it much easier to review and validate individual parameters and their values. It includes a handy utility to copy the payload directly in JSON format—useful in situations where the exact parameter structure/values need to be communicated to other team members.
- A third option is monitoring the events directly in the Amplitude user interface by filtering to the visitor profile that is being used to perform the test and monitoring the events as they show up directly in the Event Stream. This option is quite robust (see detailed explanation and video walkthrough) and is reminiscent to the type of capability Google Firebase (GA4) offers with their DebugView feature. It also seems to be the option best fitted for the validation of events sent via Android or IOS apps or for Amplitude's server-side HTTP API-sourced data.
Automated Validation
While manual validation options are very robust, when tracking user journeys Amplitude implementations often require tens (hundreds?) of tracking requests, each tracking request in itself loaded with dozens of event and user properties. Organizations that are mindful about data quality would need to invest significant time and human resources in manually validating such requests with each development cycle—an exercise that is repetitive, very detail-oriented, error-prone and let's face it, incredibly boring! Luckily, automation is never bored and its value prop scales up perfectly the more requests you have to validate!
QA2L Enables Fully Automated Tag Validation for Amplitude Events
Using QA2L visual design interface you can build rules for the various Amplitude events and their attributes as they fire on the corresponding steps of your user journeys. Once the rules are in place, QA2L's automation technology will step through the list of recorded interactions on a schedule that you have selected. The automated tasj will send you alerts whenever any of the individual parameters deviate from the rules you have established.
Designing automated validation tasks is done is three steps:
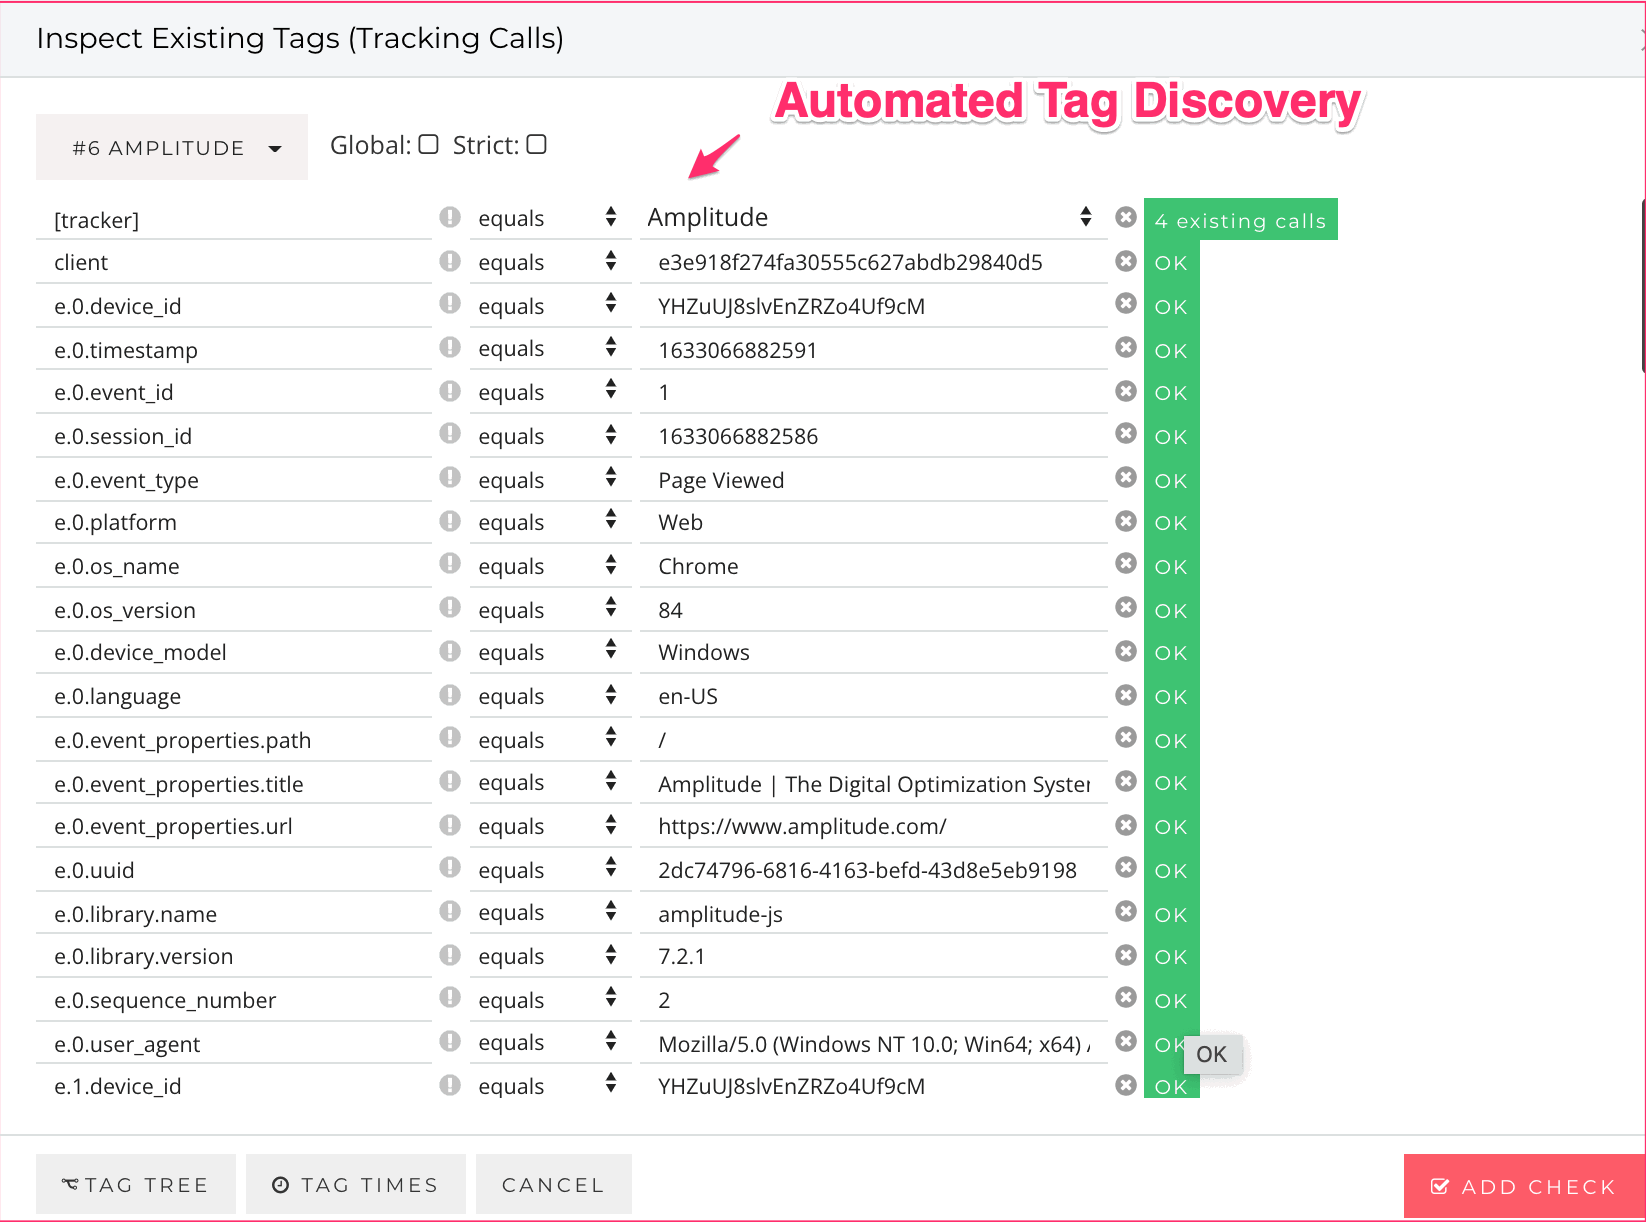
1. Use QA2L visual designer to navigate through your site's key site journeys. As you go through each step, QA2L automatically discovers all Amplitude requests and breaks down the JSON payload in a user-friendly format:
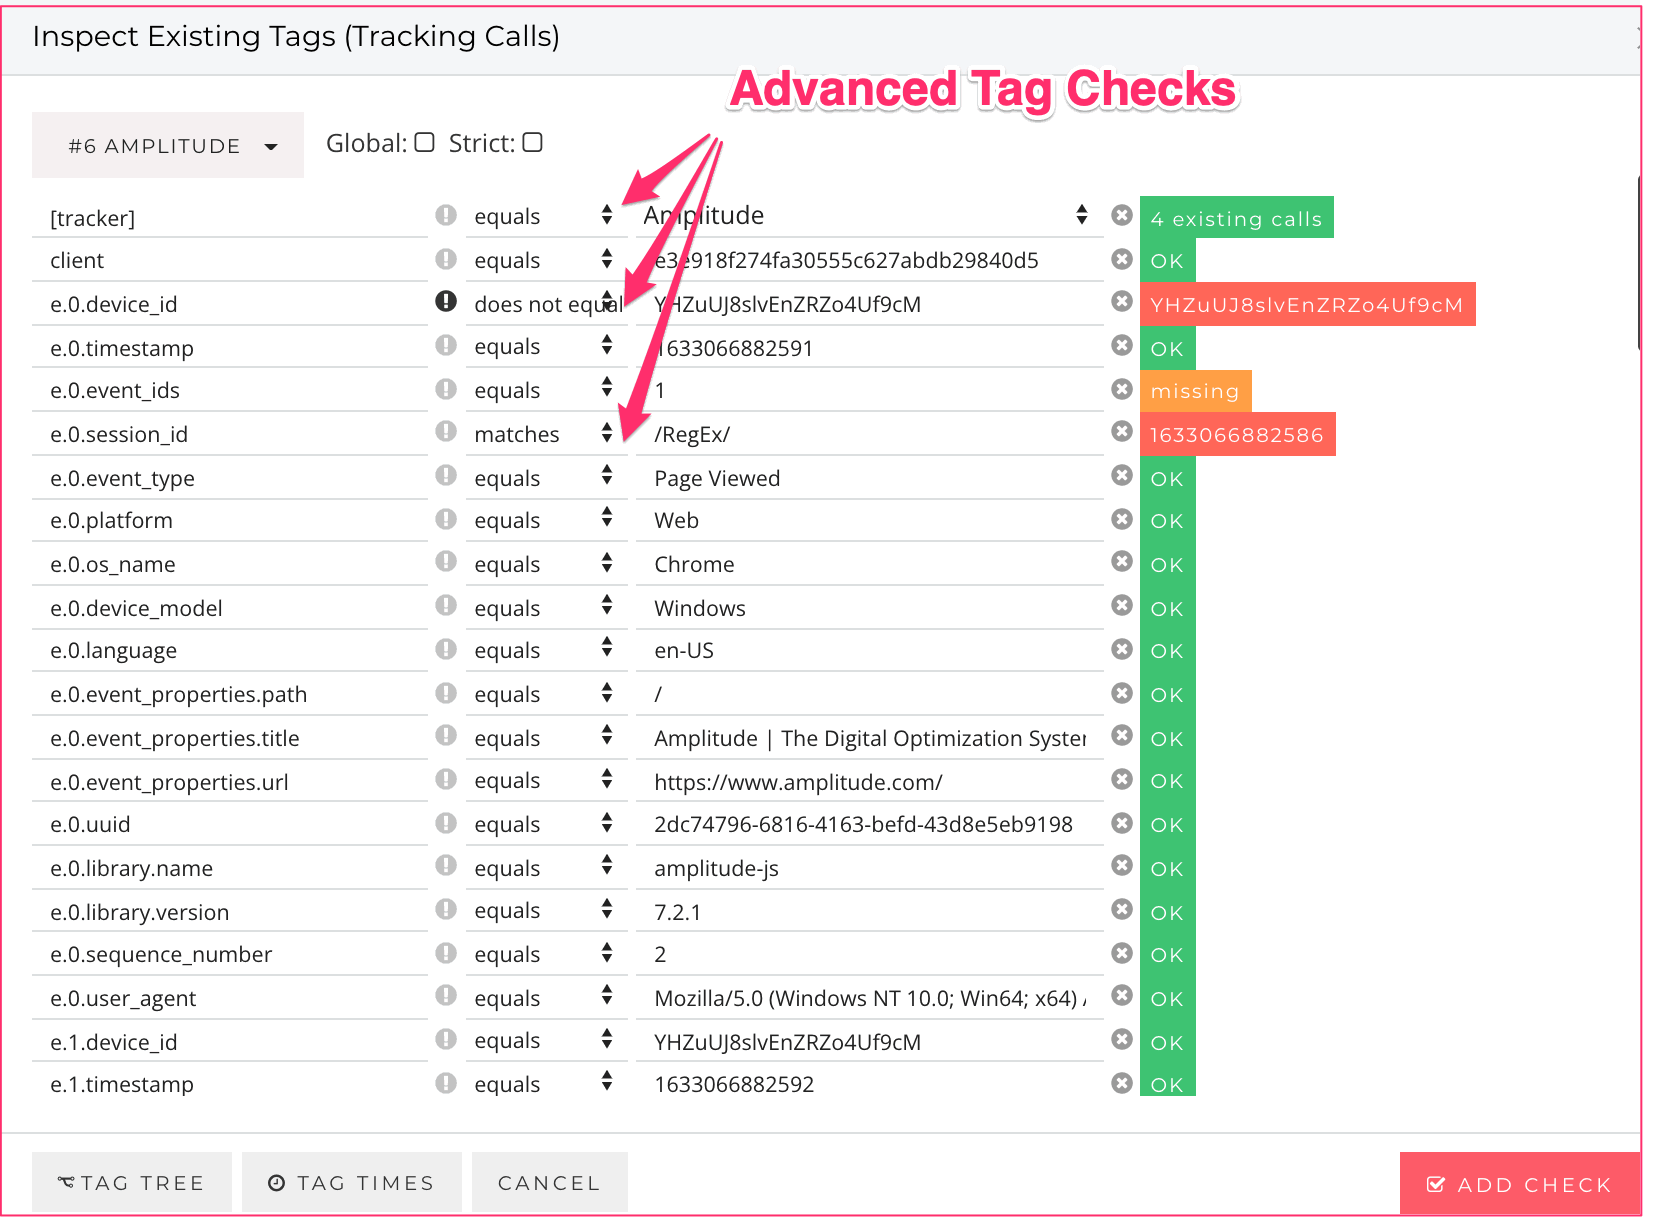
2. Use QA2L's comprehensive set of operators to set even the most advanced validation rules, not just simple string matches and wildcards, but also RegEx, strict parameter checking, occurrence counts, referential checks, etc:
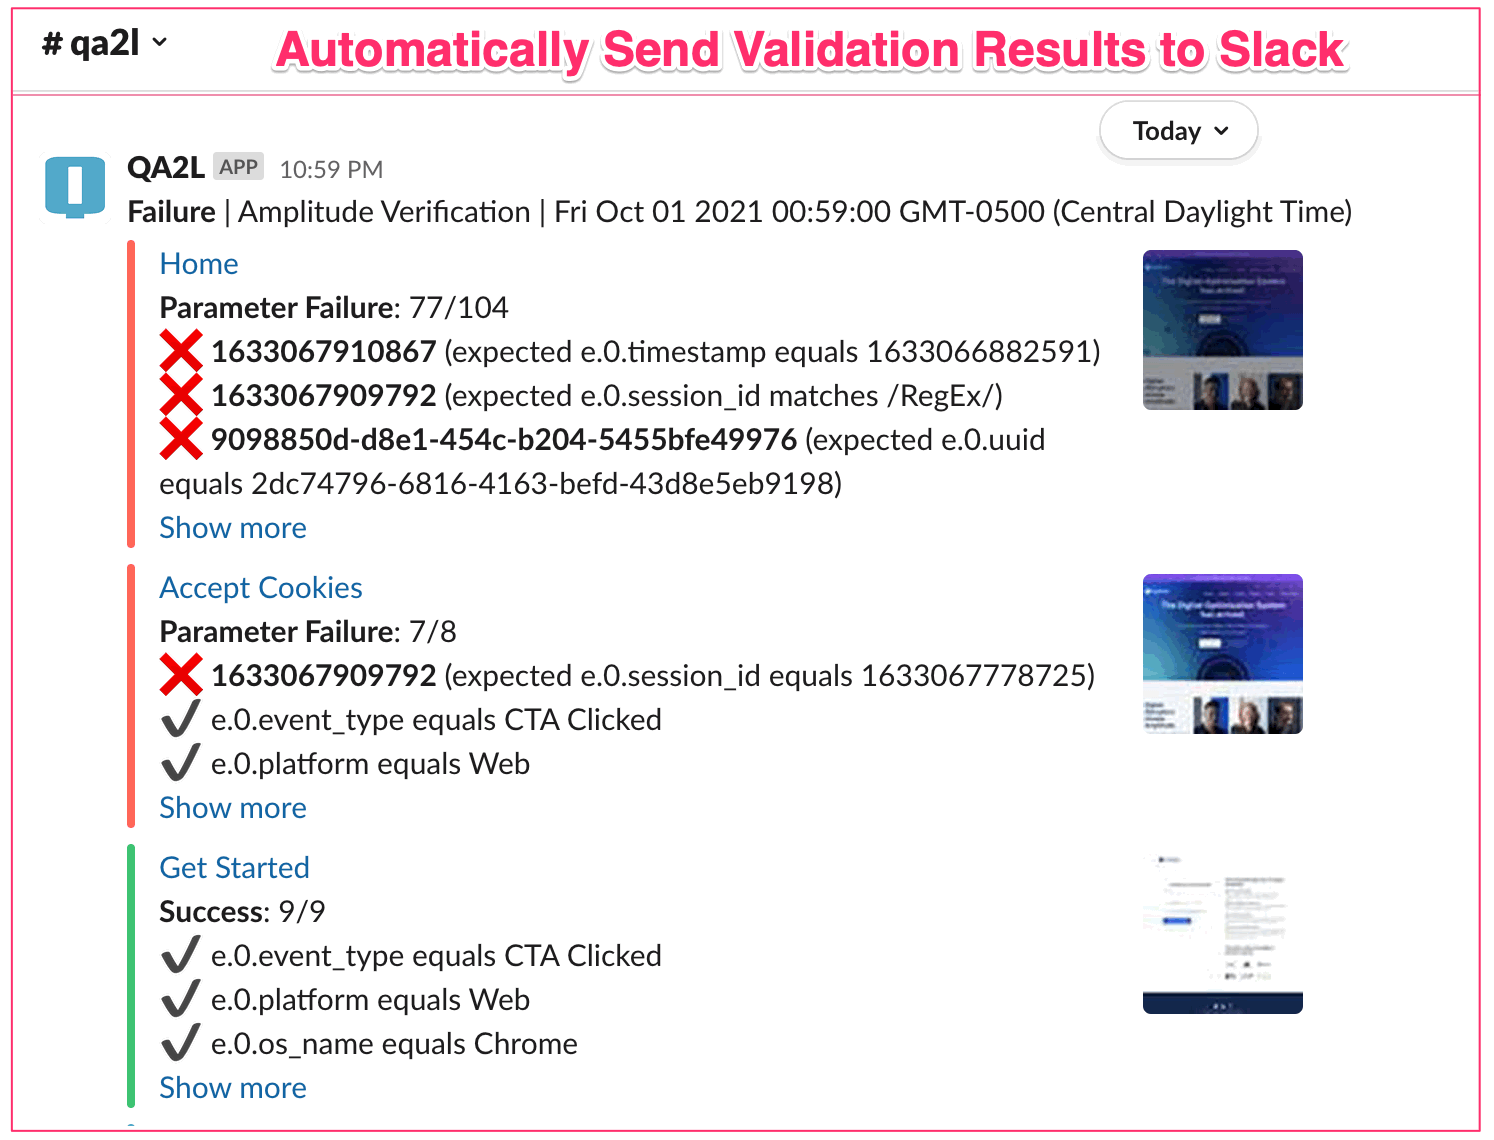
3. Schedule the tasks you build to run autonomously, alerting you only when anomalies are discovered via email, Slack, Teams, or Confluence.
Advanced implementations can further leverage QA2L's powerful API to integrate analytics QA automation into an organization's continuous development cycle, ensuring that tracking defects never leak into production.
If you are interested in seeing this process in action:
REQUEST A DEMO
Tags: Data Quality Product News